How to deploy modern methods to close the data gap
Metallurgical accounting is nothing new. For as long as people have been mining and processing ore, they’ve been working hard to make the process more efficient. From manual spreadsheets through to custom software, it’s been slow and steady progress over decades.
However, 2024 marks a tipping point. The combination of mandatory finance-grade sustainability reporting, the global push towards net zero emissions and the acceleration of digital transformation have made adopting modern metallurgical accounting essential to remain competitive and meet compliance obligations.
This comprehensive guide covers the essentials of metallurgical accounting, compares traditional and modern methods, outlines the major governance frameworks operators need to understand, and explains how modern technology can meet evolving challenges.
Even the most sophisticated spreadsheets will no longer do the job. The era of digital metallurgical accounting has well and truly arrived.
Contents
- Definition: What is metallurgical accounting?
- Definition: What is metal accounting?
- Definition: What is production reporting?
- Definition: What is production accounting?
- Why is accurate metallurgical accounting important in mining and minerals?
- Metallurgical accounting methods: Traditional v modern approaches
- Traditional metallurgical accounting methods
- Challenging questions raised by traditional processes
- Example of the traditional approach to metallurgical accounting:
- Traditional calculation method: Spreadsheets
- Traditional calculation method: Statistical data reconciliation (SDR)
- Modern metallurgical accounting approach
- Advantages of the modern v traditional methods
- Example of the modern approach to metallurgical accounting
- Modern calculation method: Dynamic process simulation (digital twin technology)
- The difference between SDR (using RSS) and dynamic simulation
- Case studies: Applying the modern metallurgical accounting approach
- What are the governance frameworks for metallurgical accounting?
- Primary sustainability reporting frameworks
- AMIRA P754 Code of Practice for Metal Accounting
- Sarbanes-Oxley Act of 2002 (SOX)
- The UK Corporate Governance Code
- The King Report on Governance for South Africa and the King Code of Governance Principles (King III)
- ASX Principle 4
- SAMREC Code and the JORC Code
- International Council on Metals and Minerals (ICMM)
- The metallurgical accounting challenge: A lack of accurate data and digital tools
- Introducing Metallurgical Intelligence (MI)®
- Take control of your metallurgical accounting
Definition: What is metallurgical accounting?
Metallurgical accounting is a systematic approach involving the measurement, analysis, and reporting of the metal production process, spanning from ore extraction and plant processing to the creation of a final saleable product and the generation of tailings or waste residue.
This process entails conducting a comprehensive mass and energy balance throughout the entire plant operations, tracking inputs and outputs in metallurgical processes. Key aspects include analysing ore composition, metal recovery rates, plant mass balance and material losses. It reconciles data sets, identifying and analysing any discrepancies or biases.
Metallurgical accounting monitors and reconciles the flow of valuable metals within a process plant, addressing inputs, final product creation, tailings generation and changes in inventory. It necessitates accurate mass measurement, sampling and chemical analysis, considering the evolving conditions of the process over time (like varying flow rates, tank levels, ore grades, density and stream concentrations). Metal in does not equal metal out at a single point in time due to changes in inventory.
The accurate data generated supports inventory valuation and financial reporting, serving as an interface between technical and financial performance measurements. It also helps to plan for production and logistics to move stock on hand from one location to another such as a concentrate to a smelter.
Metallurgical accounting achieves both primary metal balance (across the entire production process) and secondary metal balance (across each section of the process flow sheet within the entire production process), providing end-to-end visibility from mine to product.
When executed comprehensively, it optimises resource utilisation, enhances efficiency and ensures accurate reporting of metal production, contributing to economic and environmental sustainability in the mining and metals industry.
Definition: What is metal accounting?
Metal accounting is another name for metallurgical accounting, and they are often used interchangeably. For a more formal definition, the AMIRA1 P754 Code of Practice for Metal Accounting defines metal accounting as:
‘The system whereby selected process data (pertaining to metals of economic interest) is collected from various sources including mass measurement and analysis and transformed into a coherent report format that is delivered in a timely fashion in order to meet specified reporting requirements.’
And in the book An introduction to metal balancing and reconciliation Morrison defines it as:
‘Metal accounting is the estimation of (saleable) metal produced by the mine and carried in subsequent process streams over a defined period of time. The comparison of estimates from different sources over a defined period is called reconciliation. Over the life of a mine, metal accounting and reconciliation constitute an audit of the mineral resource.’ 2
Further, Morrison describes the metal accounting process as combining a broad range of technical areas, including:
- Sampling and assaying
- Mass and volume measurements, including stockpile surveys and precise flow measurements
- Mathematical and statistical analysis
- Geological modelling, for reconciliation to the mine
- Effluent characterisation for environmental monitoring and control purposes
- A detailed knowledge of pyro- and solution-chemistry, where smelters and refineries are involved.
Definition: What is production reporting?
Production reporting analyses, tracks and visualises the current and historical performance of a production facility. The reports can take the form of dashboards, written summaries, charts and graphs.
The goal of production reporting is to accurately monitor existing activity and optimise the efficiency of the plant in terms of material output, metal recovery, losses, environmental impact, downtime and equipment utilisation to maximise returns over time.
In a metallurgical facility, production reporting makes use of metallurgical accounting to present production figures and operational metrics to internal and external stakeholders.
Definition: What is production accounting?
Production accounting – which is another name for production reporting or metallurgical reporting – monitors and measures each production process within the supply chain by measuring movement in inventory at a defined period such as daily, by shift or by month.
A reconciliation is performed between what is calculated and what is measured (such as stock levels). Any differences that are calculated are considered unaccounted gains or losses and can be investigated for process improvement across the value chain.
The most effective production accounting and reporting draws from actual data measured direct from the source, rather than using assumptions, averages and estimations based on samples and broad input and output inventory measurements.
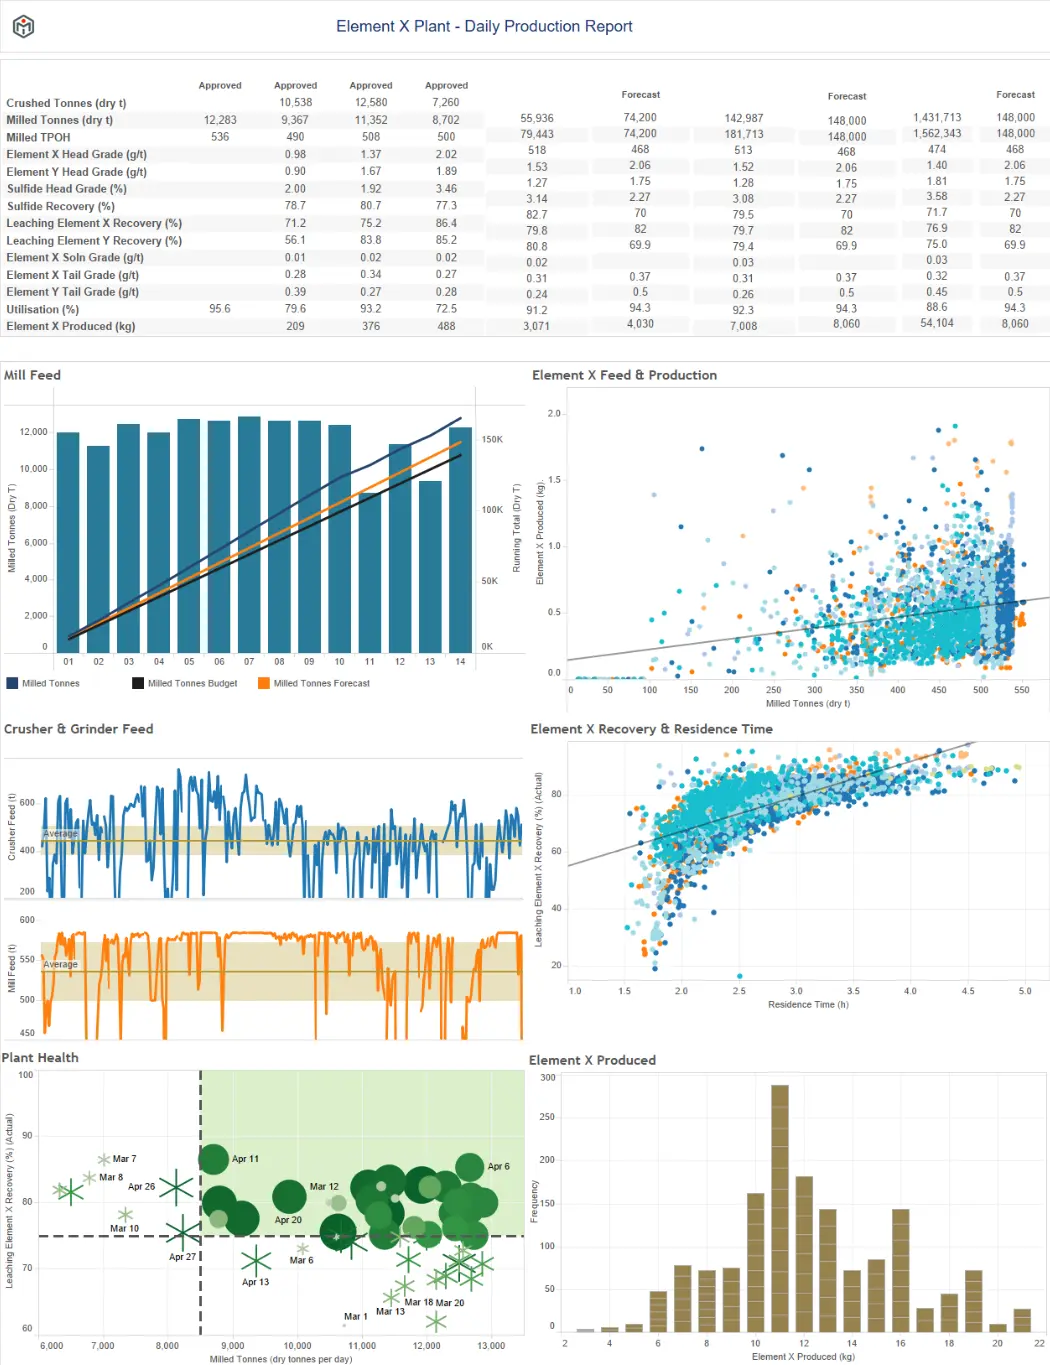
Example of a production report:
Below is a sample production report for a metallurgical facility generated by a modern metallurgical accounting solution.
It accurately presents key metrics such as feed, head grade, recovery, utilisation (%), concentrate produced, leach inventory, plant health and total production, and allows for comparison of these metrics to budgeted and week-, month- and year-to-date values.
Why is accurate metallurgical accounting important in mining and minerals?
Accurate metallurgical accounting plays a pivotal role in ensuring the overall sustainability and success of mining and minerals organisations by providing the necessary data for efficient operations, responsible resource management and transparent reporting.
It is crucial for several important reasons:
- Financial accuracy: Metallurgical accounting ensures precise reporting of metal production. Inventories are reported in financial statements and are only considered reliable if the metals in stock have been measured within acceptable tolerances. This is vital for transparency, regulatory compliance and maintaining trust with stakeholders, including investors and regulatory bodies.
- Operational efficiency: The data generated through metallurgical accounting enables organisations to identify inefficiencies and losses at each stage in the metallurgical process, allowing for targeted improvements and continuous optimisation to enhance profitability.
- Maximising finite resources: By accurately tracking inputs and outputs, metallurgical accounting helps in optimising the use of resources, such as energy and raw materials, reducing waste and environmental impact. For example, traditionally mining companies would publish the size of a resource (e.g., X million tonnes of gold) and production (e.g., X thousand ounces of gold per annum) without publishing recovery – i.e. the proportion of the resource that is turned into product, and what is wasted.
- Risk management: Understanding the metallurgical performance allows plants to assess and mitigate risks associated with fluctuations in ore quality, market conditions and environmental impact, contributing to long-term sustainability and delivering corporate governance best practices.
- Sustainability reporting and performance: By minimising material losses, optimising processes and generating accurate data around emissions, power, water consumption, reagents, waste and tailings, metallurgical accounting supports environmentally responsible practices. It helps plants meet reduction targets and comply with legal and regulatory sustainability frameworks.
- Fast, informed decision-making: Accurate and timely metallurgical accounting data enables informed decisions by providing a clear picture of the factors influencing production, allowing organisations to adapt strategies and respond effectively to changing conditions.
Conversely, flawed metallurgical accounting leads to a lack of transparency for stakeholders, reduced sustainability outcomes and allows poor management to go unchecked by regulators and shareholders.
Metallurgical accounting methods: Traditional v modern approaches
Broadly speaking, there are two different approaches to metallurgical accounting for a metallurgical process plant.
- The traditional approach typically uses periodic sampling to estimate metal content, bulk measurement of input/outputs and manual data collection and record keeping using spreadsheets, such as Microsoft® Excel, along with basic software tools. This often results in a balance over a discrete time period (e.g., a specific day or month) with little granularity.
- The modern approach makes use of advanced technologies to acquire continuous real-time source data, advanced data analytics and dynamic process simulation using mass and energy balances and advanced database structures to provide more accurate, efficient and granular tracking of metallurgical processes.
Here, we explore both options including examples and calculation methods.
Traditional metallurgical accounting methods
Traditionally, there has been no standard processes or tools for metallurgical accounting. Over the decades, each plant developed its own ad-hoc methods depending on the metal produced, the configuration of the process plant, the data needed and the technology available. In recent years, methods range from manually updated spreadsheets through to basic software built in-house or purchased off the shelf.
Often, these legacy methods were originally developed as part of a project that has long since ended, by staff members who have moved on, taking their knowledge with them.
The traditional process
Despite their differences, traditional metallurgical accounting systems tend to follow the same general process:
- Data is manually extracted from historians, laboratory assay and plant weighbridge data sources
- Calculations are completed from this data
- A smaller amount of data is generated for reporting
- Daily estimates are made and data that is collected over the course of the month is used to derive a month end value
Challenging questions raised by traditional processes
Digging a little deeper into the traditional methods, it can be difficult to get the detailed answers needed to optimise operations and reporting. For example:
If a reported number is unexpected, is it real? What caused the variation?
On a particular day, a reported figure based on a calculation, such as recovery or reconciled head grade, may come back with a value that was unexpected. A calculation like this could be based on many different parameters using different types of data.
For example, it could take volumetric flow data from multiple flow meters, and metal grades from several plant assays collected from several different sample points and prepared at a few different sample stations at different times across a day. Which one of these parameters changed so that the final calculation results also changed?
The calculation method itself may not be transparent or well understood. Is this parameter calculated in the same way every day?
If the source data contains unexpected figures, are these inaccurate?
Upon analysis, some of the data appears to be different – either there is a clear deviation from recent values, or a deviation from expectations based on the situation and operator experience.
However, such differences can be real in mineral processing, due to the heterogeneous nature of the feed, as well as variations in processing performance. It is difficult to objectively know if a change in data was real in isolation.
Furthermore, this type of analysis is often being conducted in retrospect, by people who were not there during the actual event. In the absence of detailed operator logs, it can be difficult to know exactly what occurred in the plant at that time. It is important to note that if operator logs are available, they are often stored in random spreadsheets or on paper which is not easily accessible.
What happens if data is missing?
It is not uncommon for instruments to malfunction, or for laboratory assays to not be completed or delayed. How does this affect the metallurgical accounting process and the calculation of these parameters? A consistent process for evaluating data is clearly needed but is often not possible.
What happens to inaccurate data?
If problems are found with the source data, the traditional metallurgical accounting process often sees this data being changed, or deleted, with the original values not kept for comparison. This means that repeat issues may not be detected, making it difficult to find the root cause of the inaccuracy. Plant laboratories tend to keep more substantial records of problematic data as part of their quality assurance and quality control (QAQC) systems. However, this information may not be reported outside of the laboratory, meaning that the QAQC processes themselves are not validated against a broader context.
Example of the traditional approach to metallurgical accounting:
Let’s look at a typical hydrometallurgical process and the number of data points that is recorded by the laboratory and instrumentation on site.
Sampling and instrumentation:
- 78 sample points
- 25 have analysis of both solids and solution
- 4 hourly ‘composites’
Total ~800 separate analyses in a 24-hour period (excluding product quality)
+
358 instruments x 720, data taken at every 2-minute increment (mass flow/vol flow/density/level)
An estimate of total data points collected in a 24-hour day is approximately 259,000
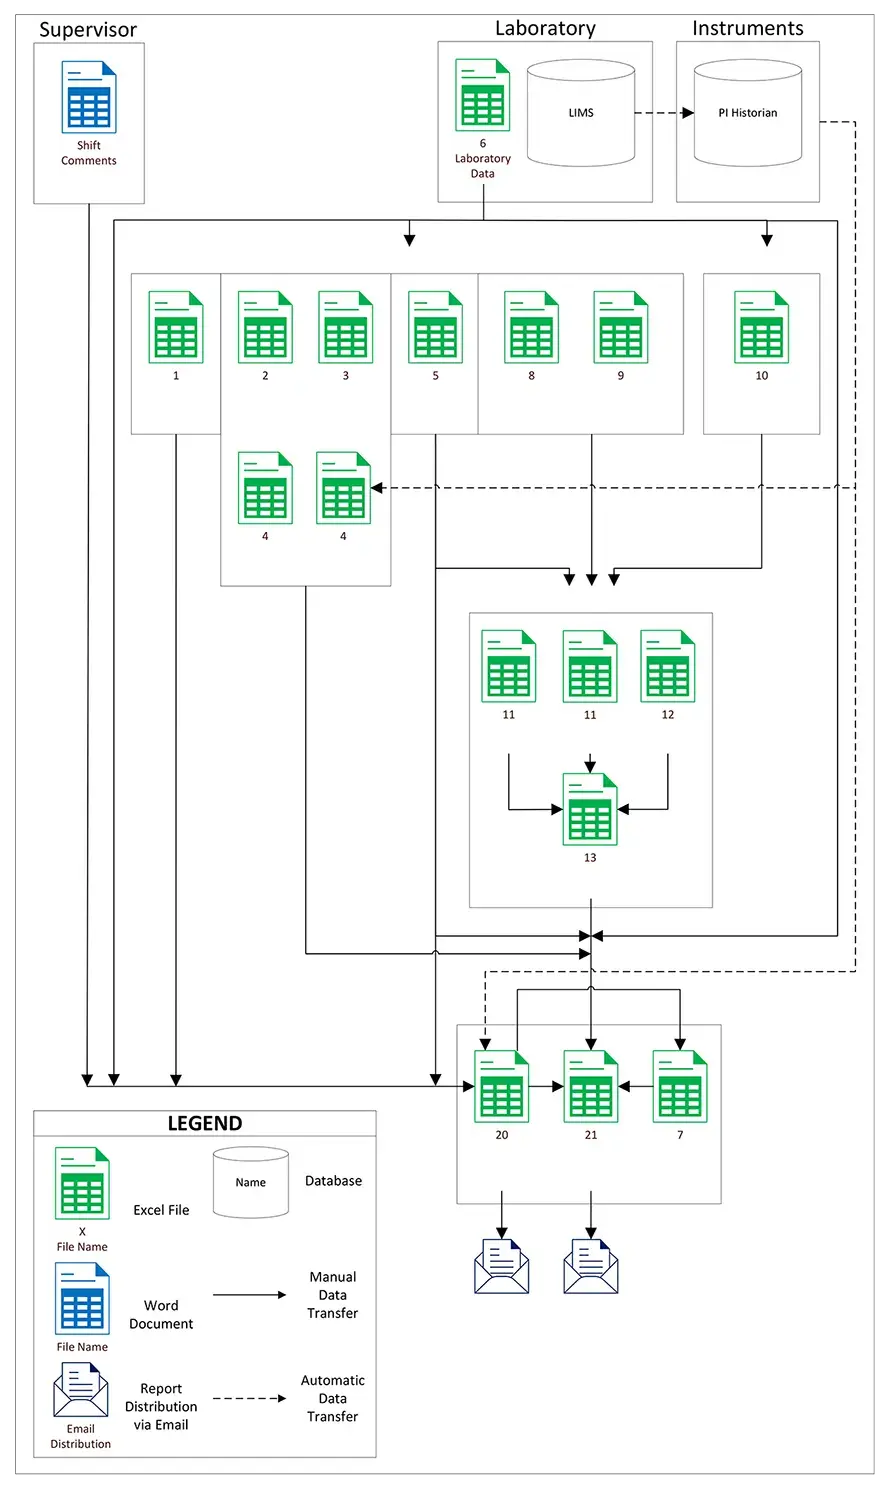
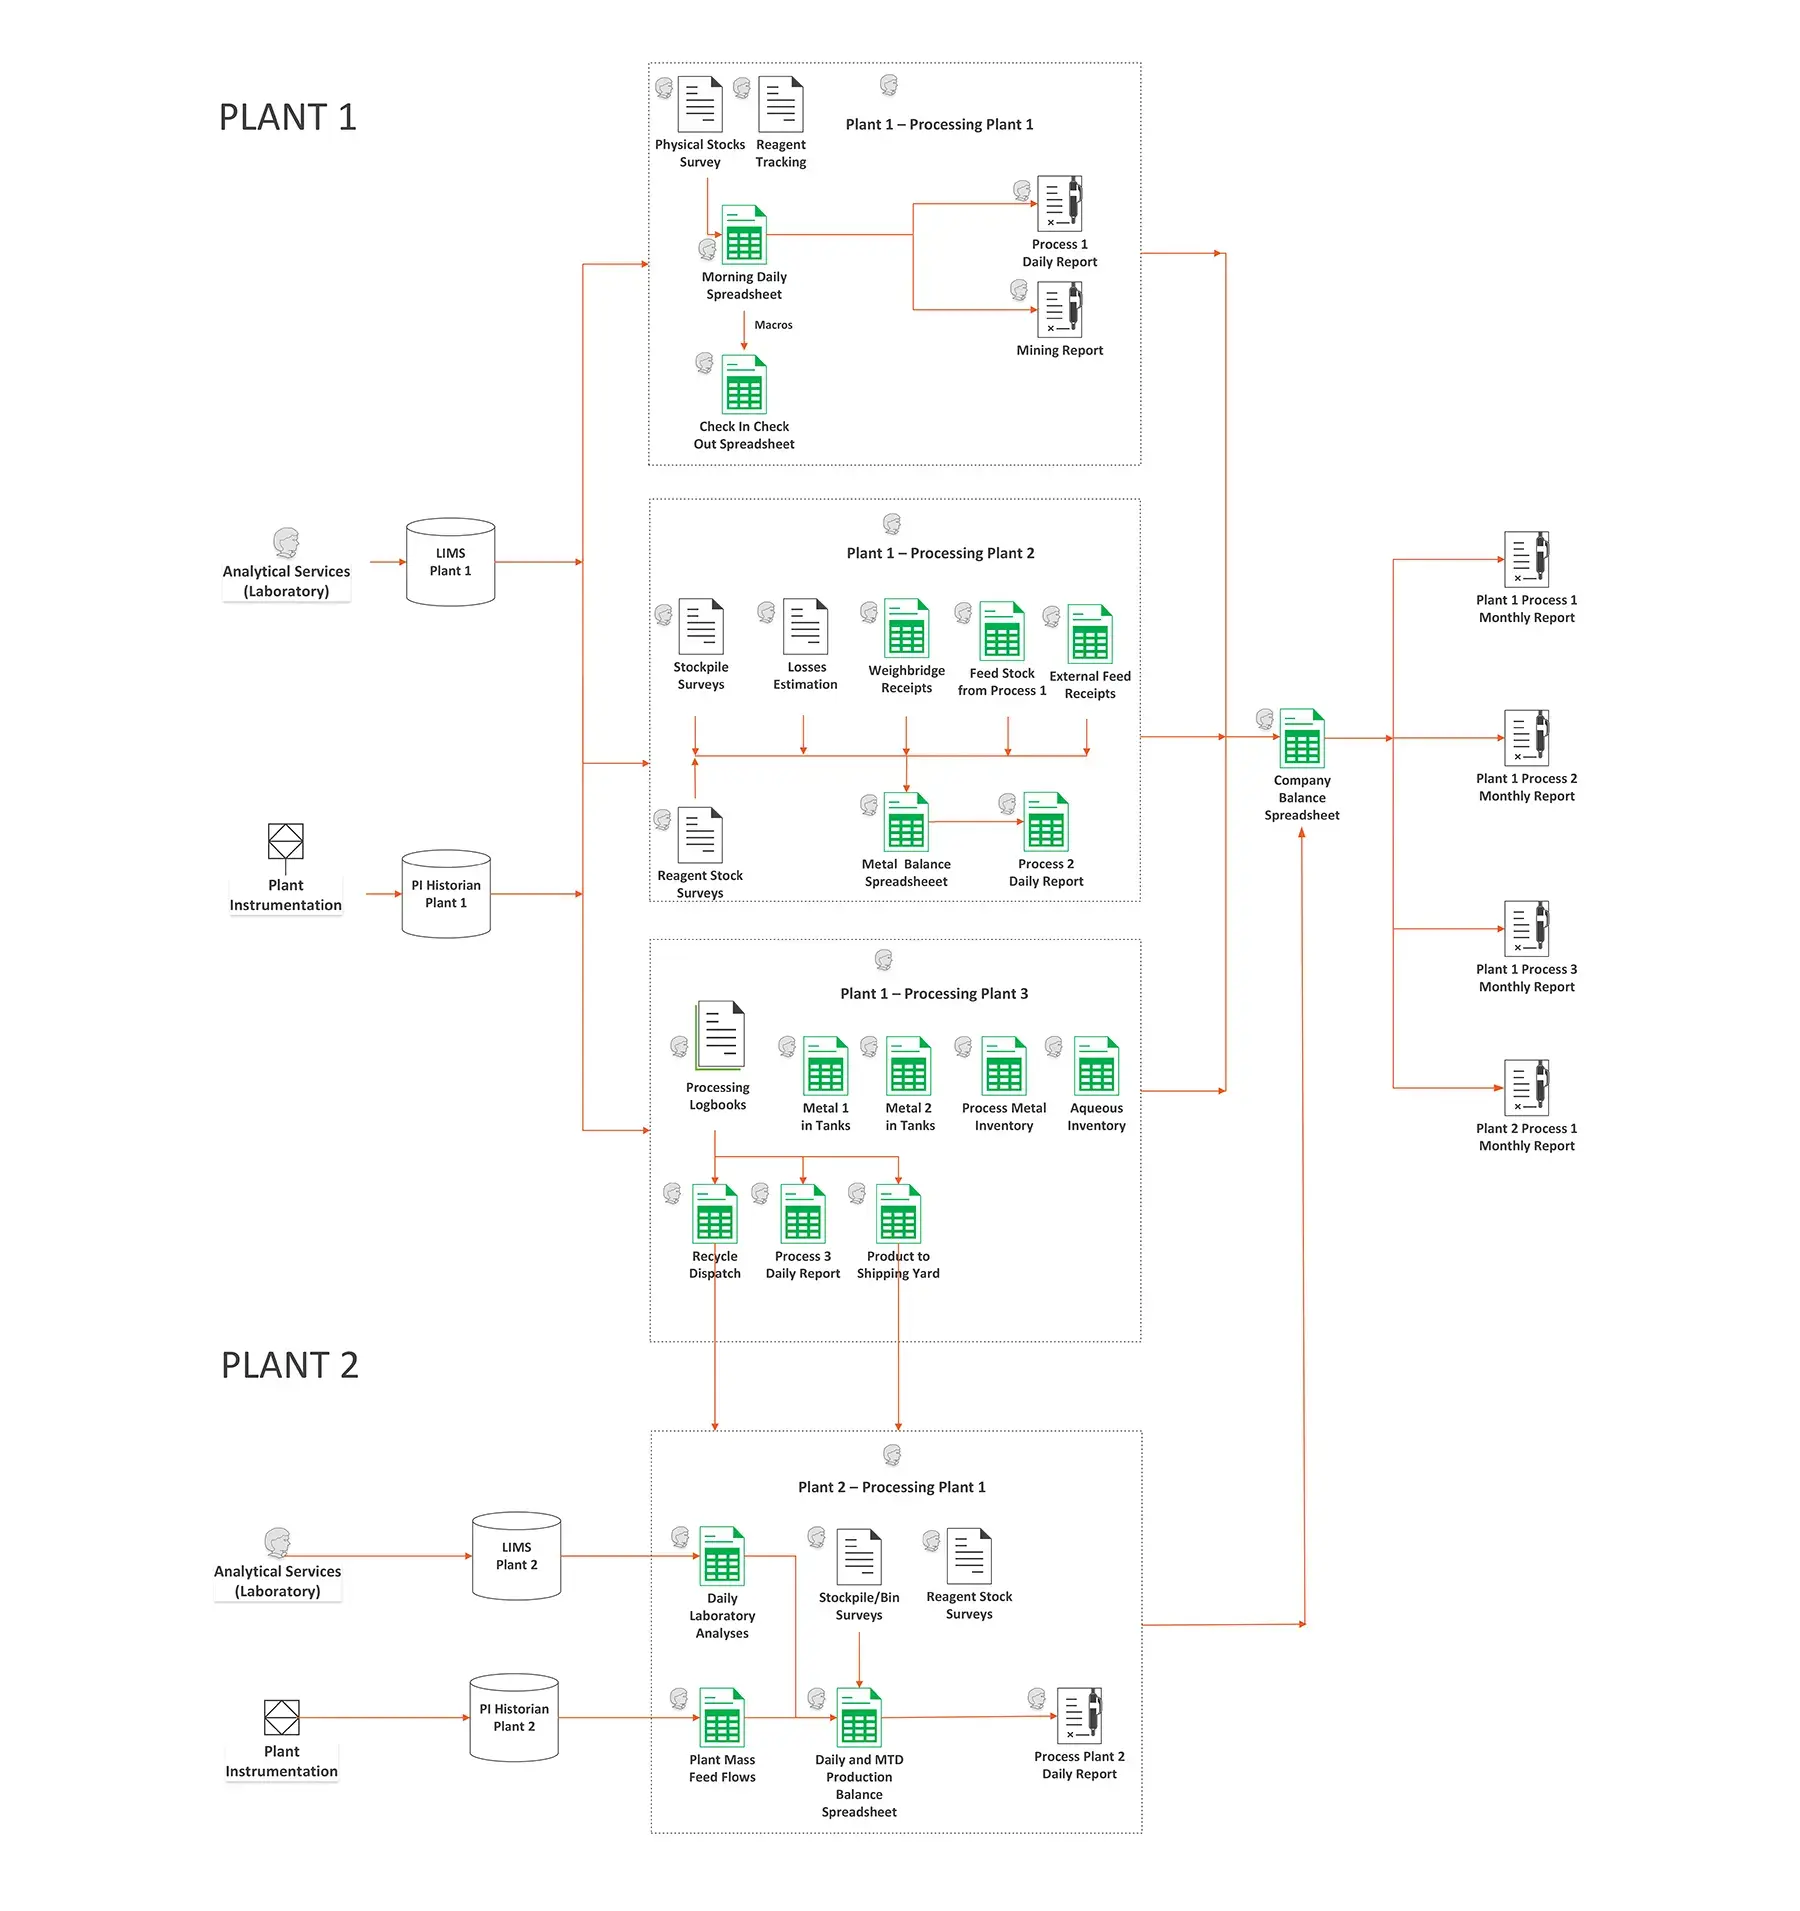
This information is recorded in a web of spreadsheets with a process that looks something like the figure below:
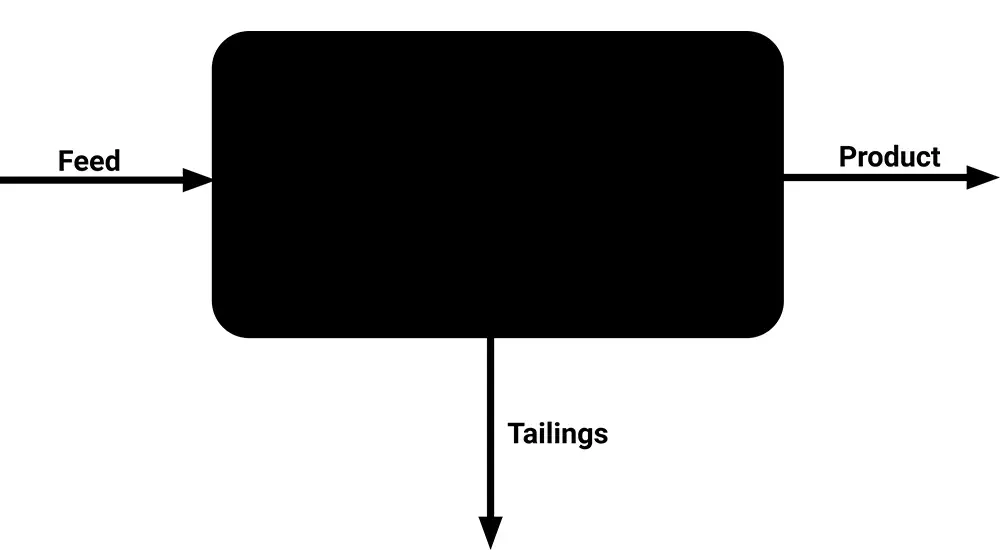
With all this data that is analysed and collected across many manual spreadsheets, it is then averaged for the month, and typically boiled down to only three primary data points being reported – feed, tailings and product.
As a result of this limited functionality of spreadsheets, this essentially leaves a black box with no visibility on all the detailed activity inside the processing plant. The potential to crack open this black box with modern data collection and analytics tools can supply the granular data needed to meet new sustainability reporting frameworks and plant optimisation measures.
Traditional calculation method: Spreadsheets
While spreadsheets are not designed to perform metallurgical accounting, most minerals processing plants continue to use them to capture, store and cross-reference data.
Reports are usually generated by manually typing or copying and pasting data into various worksheets with links to other workbooks, and there is typically little or no integration with the production plant’s source data or report distribution systems.
Advantages of spreadsheets:
- Minimal licensing costs – Most organisations already use spreadsheet
- Minimal training – Most users are already familiar with spreadsheets.
Limitations of spreadsheets:
- Data can be manipulated – Formulas and data within the spreadsheet can be modified anonymously at any time without a trace – affecting data accuracy.
- Lack of compliance – Spreadsheets are not typically traceable nor auditable, and anyone can change or manipulate data, meaning they are not AMIRA P754 compliant or have any controls in place.
- Manual – Spreadsheets are not typically connected to source data, require time-consuming data entry, often have version control issues and can be slow to process data.
- Limited data volume – The volume of data within a typical minerals processing plant is enormous, complex, multi-faceted and ever-growing. Emerging requirements to analyse, often billions of rows of production data from increasingly complex plant instrumentation, extends well beyond the scope of a standard spreadsheet.
- No error control – There is no debugging capability, and no way of instantly knowing if and where an error has occurred. If the wrong figure is accidentally entered into a particular cell, or there is an unknown issue with a formula calculation, it can render the analysis or reporting completely incorrect, which can have very far-reaching consequences.
- Limited scalability – In metallurgical facilities, reporting is ongoing and frequent. When using spreadsheets, there’s very limited re-use of data, or ability to scale the spreadsheets based on growth or changes in the plant’s facilities. The formulas embedded in spreadsheets can take time to de-code, and they can often be deleted as a ‘copy and paste as values’ before distribution. Compiling a new report will often involve the time-consuming and error-prone process of cutting and pasting data from one tab on a spreadsheet to another.
- Lack of automation – When a plant is using spreadsheets for its metal accounting platform, it is typically reliant upon a small group of people – or even one operator – to manage the documents. Over time, the person responsible may not fully understand the formulas within the spreadsheets and how they can be used and interpreted. The more complex the spreadsheets, the greater likelihood that they will be maintained by a single, dedicated specialist. If this particular person is away, or leaves the business, the overall metal accounting function can be seriously impacted.
- No machine learning or artificial intelligence – Spreadsheets cannot generate automated insights or improvements and rely on the interpretive power of reviewers.
Traditional calculation method: Statistical data reconciliation (SDR)
Another traditional approach to metallurgical accounting is to use a basic software solution using SDR as its calculation engine to reconcile measurement data from the process plant.
Typically, this measurement data comes from lab assays and plant instruments, and the objective of the data reconciliation is to find a set of estimates for the measured values which are as close as possible to the actual measurements taken (known as the ‘least squares’ method), so as to verify mass balance conservation laws.
Advantages of SDR:
- Simple technology – SDR uses basic technology that has been sparingly used in the industry since the early 1980s when computational power was limited.
- Basic implementation – SDR systems are not complex, because they contain little granular detail and are not industry specific. However, this leads to over-simplification and means they often apply statistics that are incorrect and/or lack detail.
Limitations of SDR:
- Low data resolution – Process variability is lumped into one single averaged value for each stream, and it is common practice to use straightforward averages of several measurements of plant variables taken over a certain period of time.
- Errors may not be fully accounted for – It’s assumed the measured values used in the reconciliation have no gross errors. But if they do, it will distort the data reconciliation.
- Inventory cannot be calculated – Inventory can only be measured with manual sampling. This can lead to inaccuracies in the SDR process, considering the challenges associated with obtaining an accurate inventory survey, especially with large ore and concentrate stockpiles. The SDR engine cannot accumulate or remove material or account for residence times in a process. It does not consider chemical reactions and thermodynamics happening within the process over time and applies overly simplified statistical analysis to data that is measured by the site.
- Data can be manipulated/altered – These systems require users to enter confidence intervals and estimated standard deviations for measured values to perform the data reconciliation used for the mass balance. These estimates can be manipulated to report more favourable KPIs such as recovery and yield. This can lead to incorrect reporting, which can affect compliance and eliminates opportunities to identify process inefficiency.
- Process optimisation may be limited – These types of solutions can perform mass balance calculations for streams that can be measured, but in reality there are many streams and inventories that cannot be measured and are unknown. Therefore, operators work with limited data – meaning opportunities to optimise processes are missed.
- Infrequent reporting – For daily reporting, inventories are simply rough estimates with associated error. Often, reporting with calculated inventory is limited to once a month.
- Data extraction is not automated – Requires manual exports and imports of data into the solution to perform the calculations. Data preparation for these systems can be time consuming and highly manual, potentially resulting in inaccuracies in the input data and slower report generation.
What is the residual sum of squares (RSS) method used in SDR solutions?
SDR solutions use the residual sum of squares (RSS) calculation to reconcile a mass balance for a metallurgical process. The key issue to consider is the underlying assumptions with the RSS method and the intention of the calculation.
RSS works to minimise the combined error of a set of variables in a balance. In essence, it implies that everything measured is wrong (contains error), and that any deviations are smoothed between all variables. This makes it difficult to determine the cause of the error.
Additionally, RSS often uses user-defined ‘tolerances’ for different variables, where it is possible to allow different error ranges for variables.
It is assumed that the measured values from instrumentation and laboratory samples do not align with mass conservation equations due to errors in measurement. So, adjustments are made to the data with the aim to make these adjustments as small as possible and in agreement with the reliability of the measurements. These adjustments are typically made to the feed, the tailings and the product streams.
RSS allows a user to define a standard deviation to a variable that is then used to determine the validity of the result. The standard deviation defines the relationship of a value to the mean – this presents another discussion around source data accuracy and how this mean is calculated.
Simply using standard deviation to determine the validity of a result is insufficient and lends itself to smoothing out all the results. When the standard deviation does not allow for a result (and the numbers do not reconcile), users then just adjust the standard deviation of their choosing to get the software solution to balance. In many plants, this effectively turns the calculation into a goal seek scenario where users can adjust tolerances across streams and potentially overstate performance.
For example, if recovery is to look favourable, a small standard deviation is applied to tailings, small or no error to product and a large proportion of the reported error then sits in the feed measurement. This creates issues in the mine to mill reconciliation as often the mine measurements do not add up to the mill measurements for ore processed at that point in time.
The assumption that measured data is full of errors is not always correct. Data is inherently variable in the mining and minerals industry and the accuracy of sampling and analysis methods should not be underestimated.
This is why data validation techniques and contextualising measured data is so important when performing a mass and energy balance reconciliation for a metallurgical process.
The difference between these methods and leading metallurgical accounting technology available to the industry today, such as Metallurgical Systems MI Core® software, is that rather than spreading the error the modern software takes the source data on its face value and uses it to complete a mass and energy balance.
This means that any problematic values will result in a deviation in the balance, most often seen as an unrealistic change in inventory, which is calculated and reported every hour. The nature of this deviation then allows diagnosis of the root cause.
Inventory is what connects the different pieces of the solver model together – it effectively allows the comparison of multiple mass balance calculations simultaneously. It also shows the impact of bias/skew over time, as MI Core® completes the same calculation every day and uses yesterday’s closing inventory as its starting point.
Modern metallurgical accounting approach
The modern approach to metallurgical accounting uses continuous, real-time data acquisition, advanced data analytics and dynamic process simulation, generating plant-wide mass and energy balances for precise and efficient tracking and managing of mineral processing operations.
The typical modern process:
- Source data is generated
- Samples are collected from the plant, prepared and analysed by the laboratory
- Plant instruments report values back to the control system
- Data is archived in historian databases
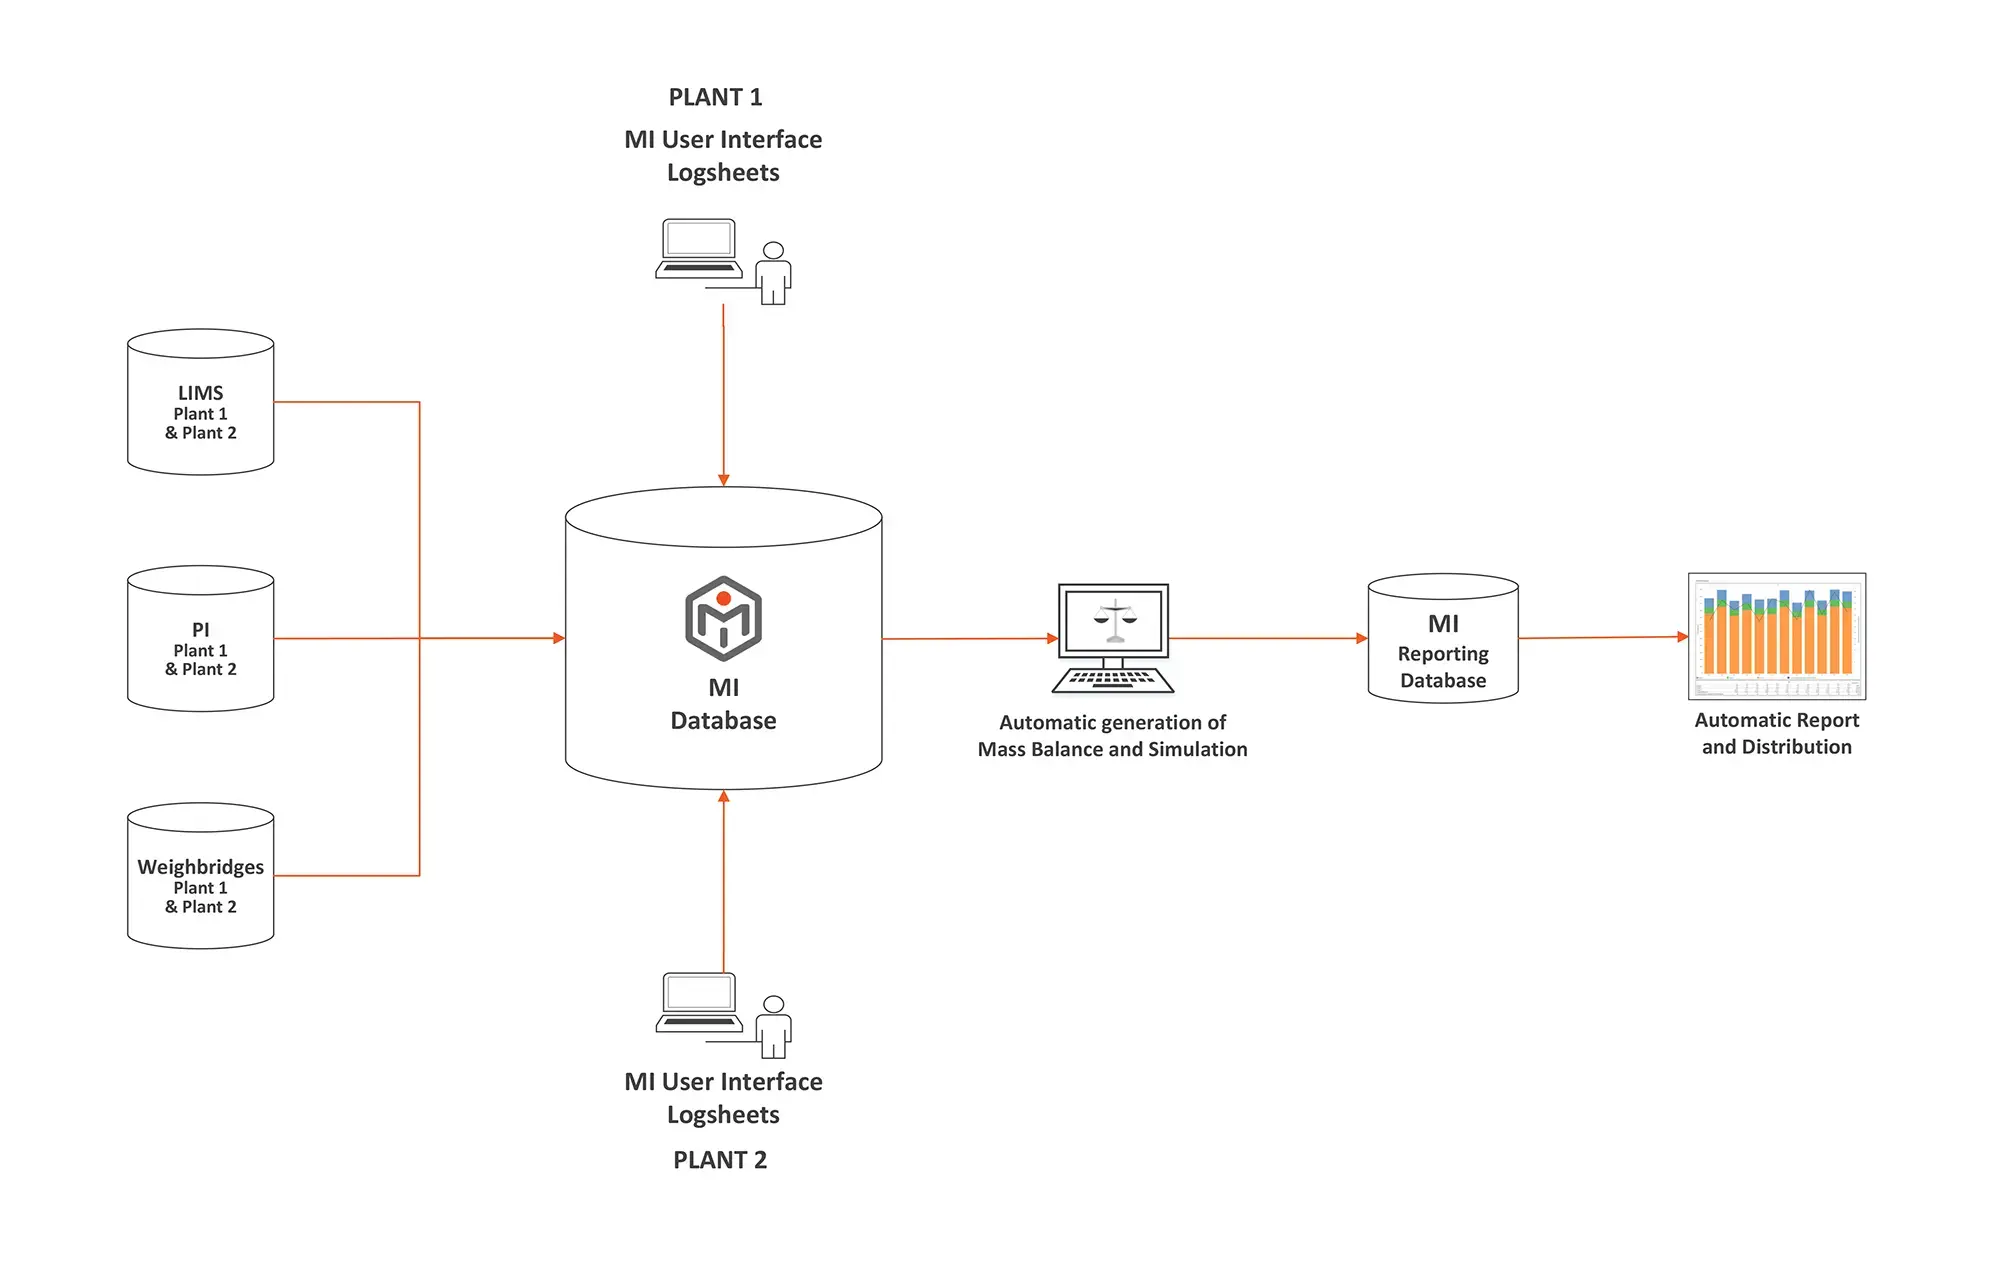
- Data is automatically collected from historian databases, laboratory management systems, weighbridge databases and manually entered digital log sheets
- A data evaluation process runs, correcting problematic data without removing it, based on consistent rules and generating data quality reports
- A detailed dynamic mass balance simulation is completed
- A significantly larger amount of data is generated for reporting
- It is completed on a daily or shift basis, using two-minute data from a range of sources
Advantages of the modern v traditional methods:
Automated data collection:
Using modern digital solutions, the data collection process is completely automated, meaning that time is not wasted collecting and adjusting data manually. It also means that data is collected in the same way, from the same places, at the same times, without interruption.
Quality control:
Modern metallurgical accounting tools include a data evaluation and quality control quality assurance (QAQC) step. This process involves evaluating every single piece of incoming data against consistent rules that are applied for each phenomenon (mass flow, volumetric flow, density, metal grade, metal concentration etc.). Data that falls outside of the range is not imported, with any omissions recorded and reported for data quality analysis. Measure points with consistent outlying values can be easily identified from data quality reporting, so that the underlying cause can be investigated and rectified.
Data quality limits:
These can be entered for individual data points, to account for samples that may not abide by the standard QAQC rules. This means that the unnecessary elimination of data can be avoided, or that QAQC tolerances can be made stricter.
Missing data is accounted for:
A second part of this data preparation involves dealing with any missing values. Where applicable, the last recorded value is held or missing data is replaced by interpolated data, so that it can be used in the dynamic mass balance. A dynamic mass balance is a simulation of the plant and process that simulates the varying behaviour of the process over time.
Dynamic mass and energy balance:
This is the most powerful and unique aspect of this modern approach to metallurgical accounting. It takes a wide variety of the collected plant information and uses it as inputs in a simulation of the entire process plant that includes all flows, chemical reactions and inventory changes across a range of elements.
The calculations completed by the mass balance are based on a very broad range of information. This means that any deviation between calculated data and the measured input data tends to reflect a disagreement between a single value or measure point and a broader consensus of instruments and assays.
The dynamic mass balance generates significantly more data than what is fed into it. It can calculate many things that cannot be measured, such as element-by-element flows or mass transfers, inventory changes or chemical reaction mass transfers and performance metrics such as efficiencies and availability. It is also able to report data at an hourly level, which is collected and stored in a single database. More data means that the statistical significance of any analysis is greatly improved, as a result of the larger population size. Unlike traditional methods, advanced dynamic simulation software can analyse many thousands of data points over time, enabling accurate reports and data-driven optimisation.
Validation of questionable values:
This large amount of calculated data, generated from a mass balance where all data is connected, and based on actual measured plant data, can be used to compare against the original incoming plant data. This is where the power of the modern metallurgical accounting method is unlocked, as this comparison can be used to validate questionable recorded values.
Where a measured value deviates from a calculated value, it has effectively deviated from a large consensus of other measured values used as inputs – it is effectively large-scale quality control analysis. This means that the data is objectively inaccurate and should be corrected, with the root cause of this inaccuracy investigated. Alternatively, a variation between the measured and calculated values could also identify undocumented process changes.
Comparing measured data against calculated data also frequently validates the measured data and confirms that it was representative of what was happening in the plant at that time. A simple example of this could be that a lower concentration assay was collected than expected when additional unmetered dilution water was being added to a tank, something that a mass balance would identify.
Example of the modern approach to metallurgical accounting:
By starting with accurate, centralised, validated and organised source data, the modern approach to metallurgical accounting equips operators to produce accurate metallurgical accounting, production reporting, process optimisation and sustainability reporting.
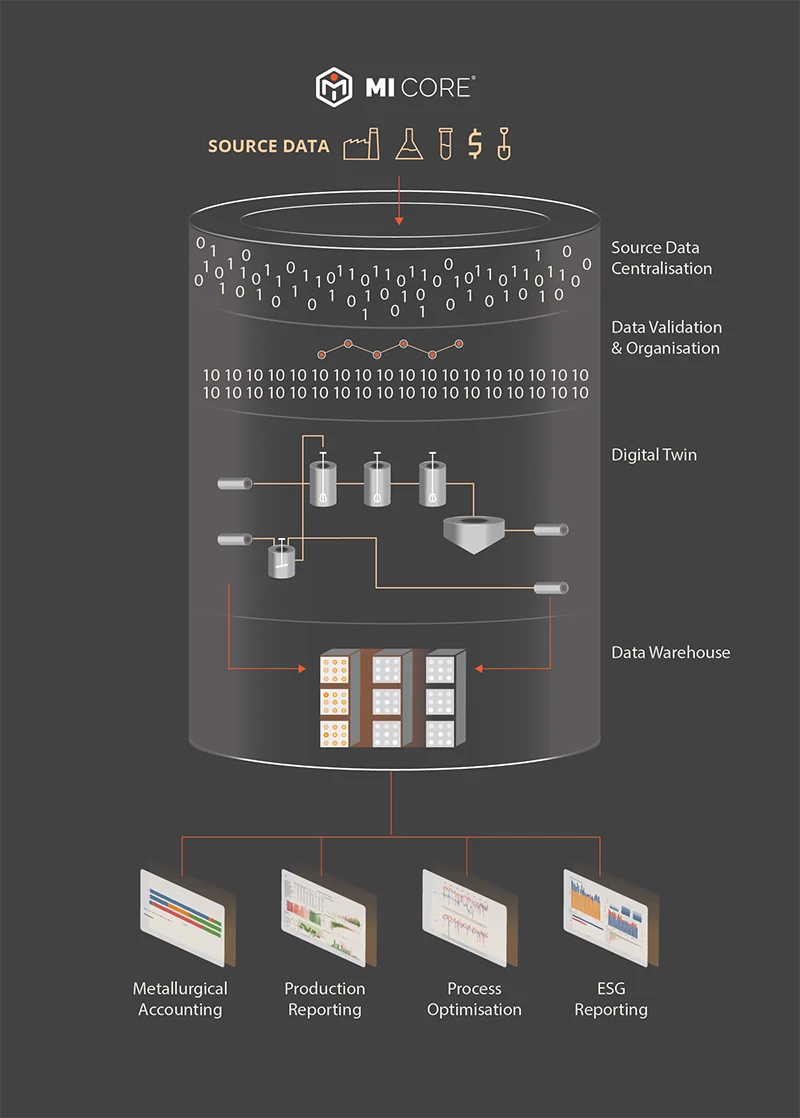
Modern calculation method: Dynamic process simulation (digital twin technology)
Dynamic process simulation – also known as digital twin technology – has been commercially available and successfully implemented globally in the minerals processing industry for over 14 years. It is gaining popularity as more organisations come to understand its many advantages over traditional SDR technologies and the value they bring (see Table 1 below).
As well as being industry specific, dynamic systems exceed AMIRA P754 guidelines (as discussed later in this article), giving stakeholders complete confidence in their data. The real value with this technology is in the metallurgical accounting and process optimisation capabilities customised specifically to the chemistry and process dynamics of the plant.
Advantages of dynamic process simulation:
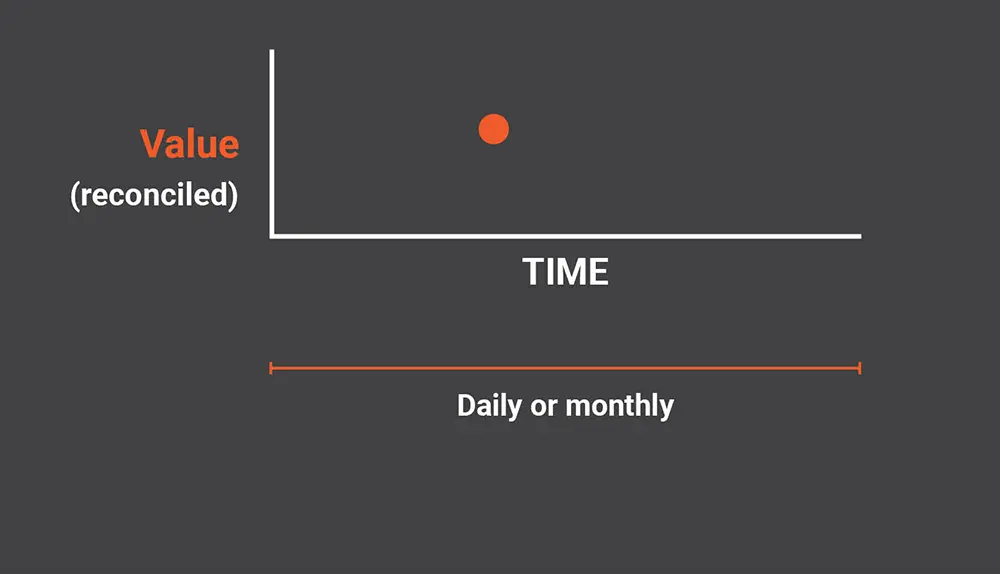
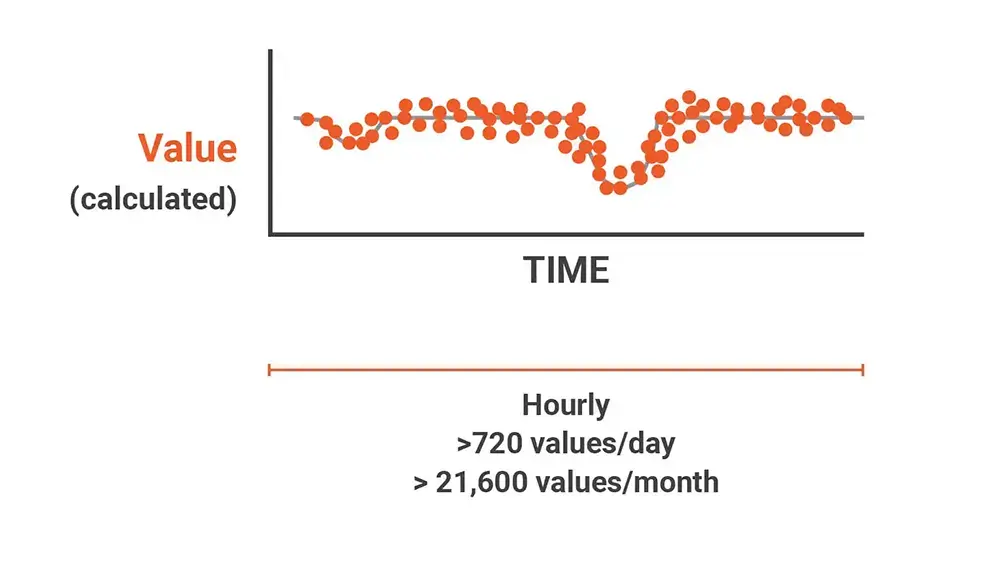
- High data resolution – With dynamic simulation, each node is simulated, with all streams and inventories accounted for. For instance, an SDR engine will complete a single plant mass balance, commonly once month, on a selected number of streams. The dynamic simulation system completes 720 iterations of a full plant mass balance for one 24-hour period.
- Anytime, anywhere access to data – Inventory can be measured at any time and isn’t limited to scheduled manual lab assays. Plant inventory is traditionally surveyed at a point in time that day, assigned as a single result for that day, and taken as the end-of-day result. Using modern dynamic simulation, that same survey sample is time-stamped for the date and time of day it was taken, which materially changes the outcome of the mass and energy balance.
- Multiple data inputs – The dynamic mass balance takes the most important information generated by the plant, such as production ore feed rates, and uses this as the main inputs for a model of the plant. It also takes into account a broad range of other inputs – including multiple sample assay results and plant instrument data. All of this information is used to create a second set of data, where flows, inventory changes and chemical and physical reactions are accounted for. The dynamic model is also able to capture volumes and residence times, which is particularly important in hydrometallurgical plants.
- Automated data transfer – This ensures information can be accessed, collected, evaluated and reported without delays or user intervention. This also reduces errors associated with manual handling of data.
- Industry specific – Importantly, these systems are also specifically created for minerals processing plants and are designed for complex chemical processes.
Disadvantages of dynamic process resolution:
- Initial set-up investment – Due to their power and sophistication, dynamic simulation solutions can be the most expensive of the options initially. However, the scope of the insights means they enable plants to achieve a rapid return on investment, sometimes a payback before implementation of the solution has been completed. It is important to note that often a lower priced solution will require significant resources on implementation to execute the desired functionality of the software, costing the organisation several times the quoted price as well as project delays.
The difference between SDR (using RSS) and dynamic simulation
Table 1: Comparison of SDR and dynamic simulation (digital twin)
| Statistical data reconciliation VS Digital Twin | |
|---|---|
 |
 |
| Statistical data reconciliation (using RSS) | Dynamic simulation (Digital Twin) |
|
|
|
|
|
|
|
|
|
|
|
|
Case studies: Applying the modern metallurgical accounting approach
The modern approach to metallurgical accounting has already been applied in many different mineral processing plants, across a variety of processes and mineral types.
These examples below, show how Metallurgical Systems has used the modern approach to evaluate measured data, particularly sampling and analysis data.
Case Study 1: Complex hydrometallurgical plant
The first case study comes from a complex hydrometallurgical plant where many solution samples are collected and analysed each day. These assay results are used as inputs into the dynamic solver model, creating a calculated dataset that makes it possible to validate some important numbers.
Reconciled plant feed, based on:
- Metal to the refinery
- Metal to tailings
Prior to the modern approach, engineers at this operation completed their metallurgical accounting using a large spreadsheet. This file had evolved over a number of years to include many data sources and hundreds of different calculations.
Different equations were used to calculate similar figures, particularly the reconciled mass of metal entering the plant. The engineers would then select which version of the calculation they would use in their reporting to avoid communicating unexpected or unfavourable operating results.
The implementation of the modern approach at this operation meant that transparent and consistent calculation methods were applied. As a result, it became possible to evaluate the quality of the incoming data, something that had not been possible in the past.
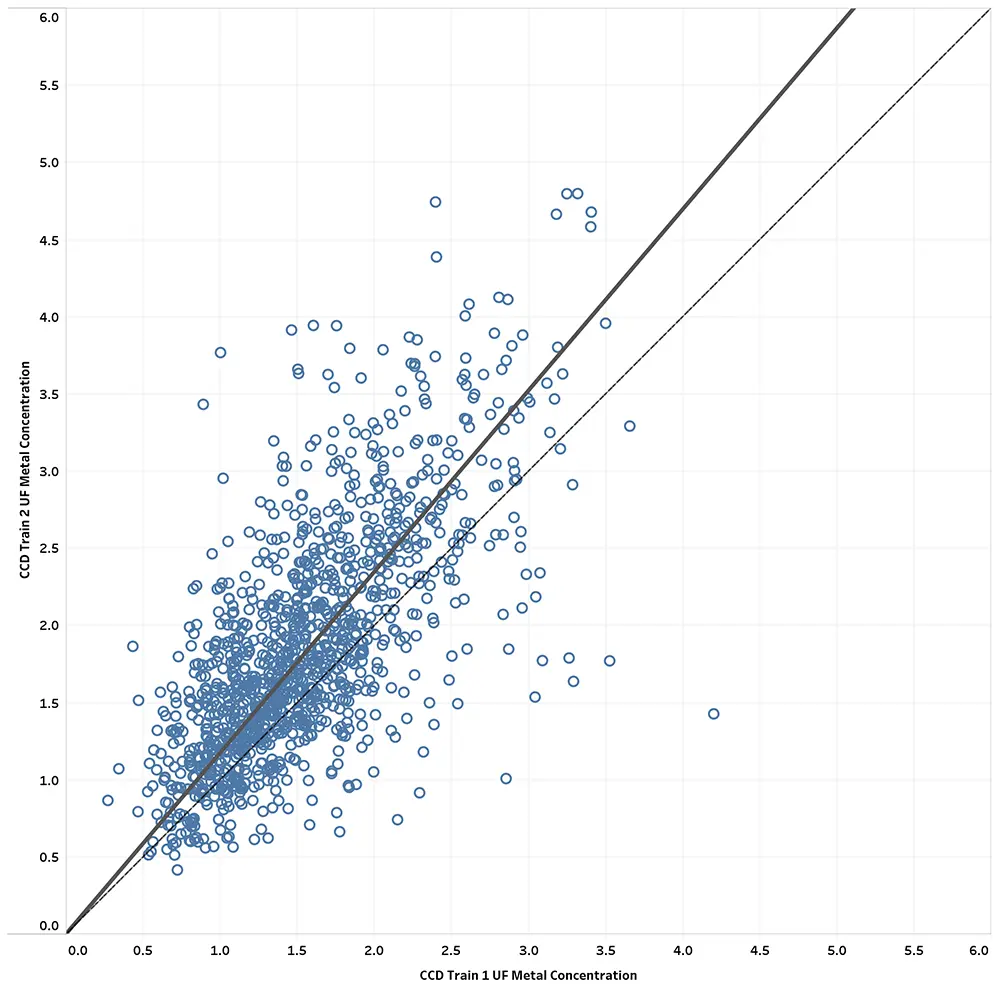
An example of this was in the assays coming from samples collected in the counter-current decantation (CCD) wash circuit. The plant has two parallel CCD trains, operated in a similar manner. However, the metal concentration measured in the final underflow samples from each train often differed dramatically, with Train 1 always reporting a lower concentration than Train 2.
Plant engineers tended to dismiss this variation as poor sample collection and filtering, as there had been perceived issues with this in the past. An investigation had been conducted, which concluded that the sampling methods were theoretically sound and the same for both circuits.
Using the modern approach, it became possible to compare the assay results from the two CCD trains over a large period. From this, it appears that the underflow metal concentrations measured in CCD Train 2 are usually higher than those for CCD Train 1. A correlation analysis between the two variables proves this (Figure 1).
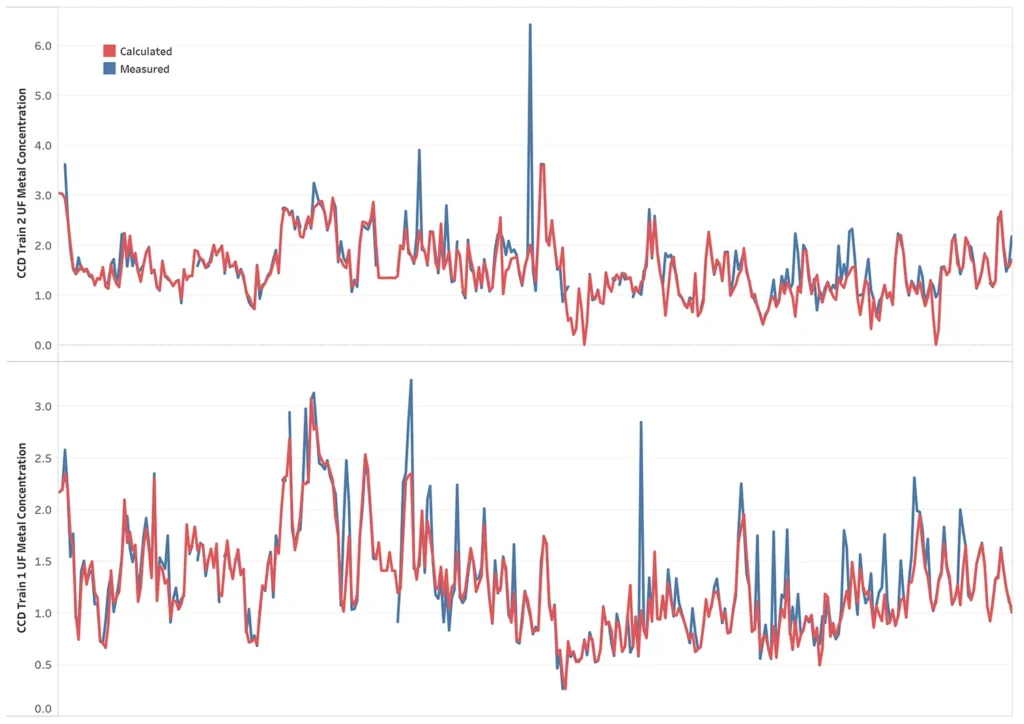
Now that we have proven that the CCD Train 2 values are consistently higher than those for Train 1, the question becomes whether this is an accurate depiction of what happens in the plant. To determine this, we need to compare the measured values from the laboratory against the calculated values from the dynamic mass balance.
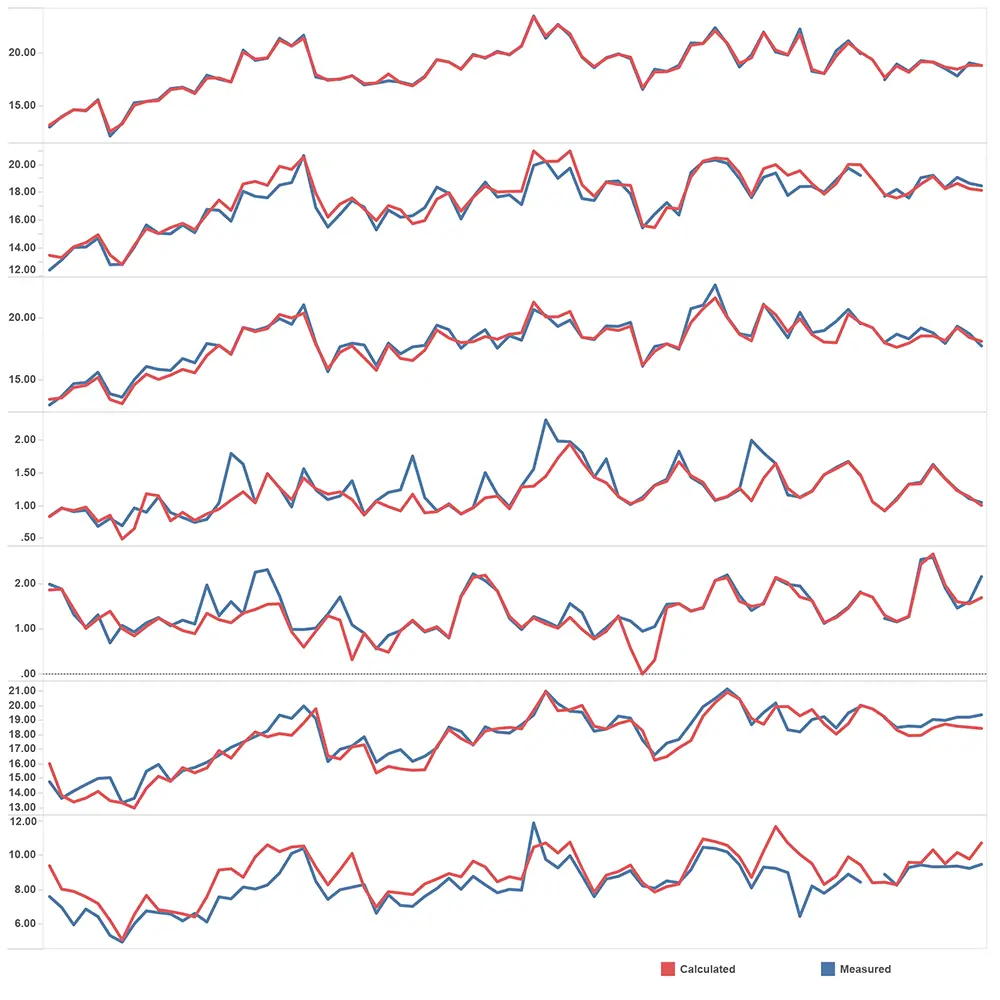
Figure 2 shows the measured and calculated values for the two variables over time. At first glance, these appear to align closely, except for a few particularly high measured values.
The close correlation between the measured and calculated values suggests that assay results from the two sample points are accurate. This means the dynamic mass balance, based on measurements from across the whole process plant, indicated that the metal concentration in the CCD Train 2 underflow is consistently higher than that in CCD Train 1.
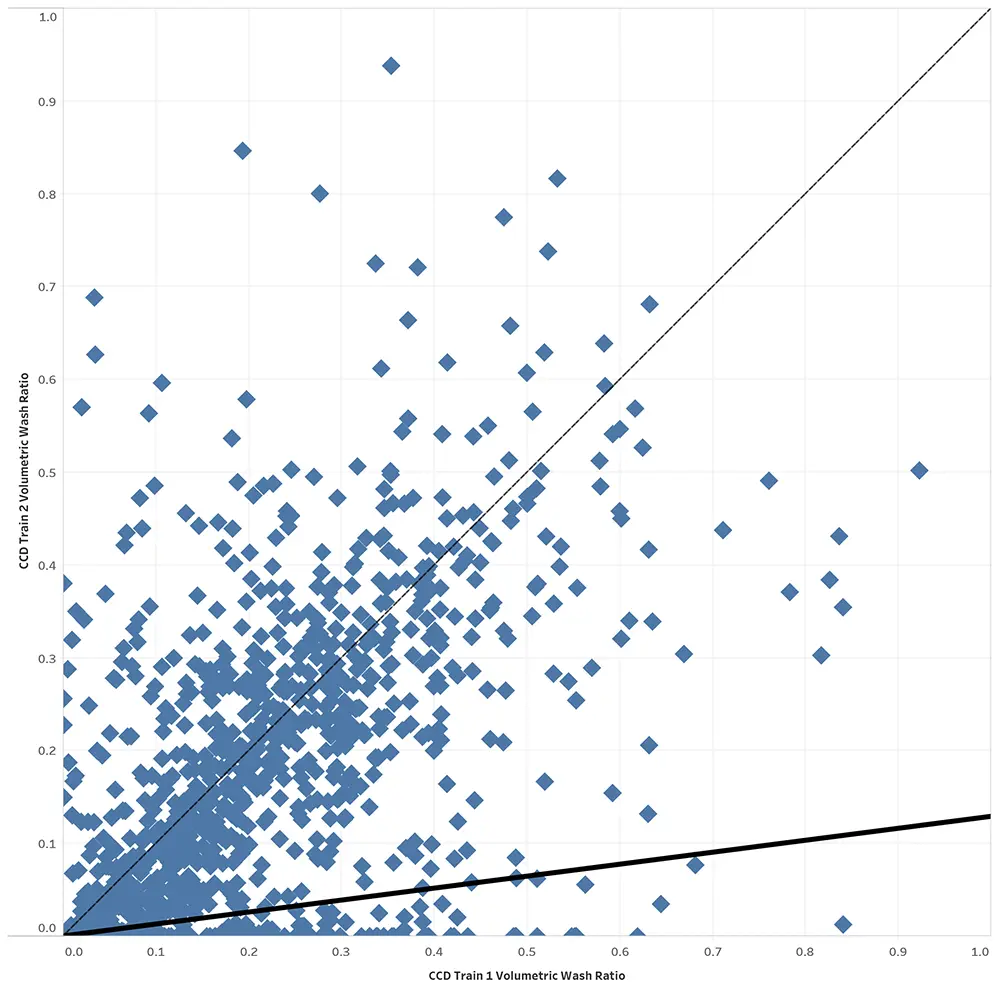
The next question then becomes: why is the concentration leaving CCD Train 2 higher than that leaving Train 1? This appears to be driven by the relative amounts of wash water that were added to the two circuits. Figure 3 shows the correlation between the wash ratio [wash volume] / [underflow volume] for CCD Trains 1 and 2. This shows that the CCD Train 2 wash ratio was often much lower than that for Train 1, and that there also appeared to be interruptions in the water going to the CCD Train 2 wash.
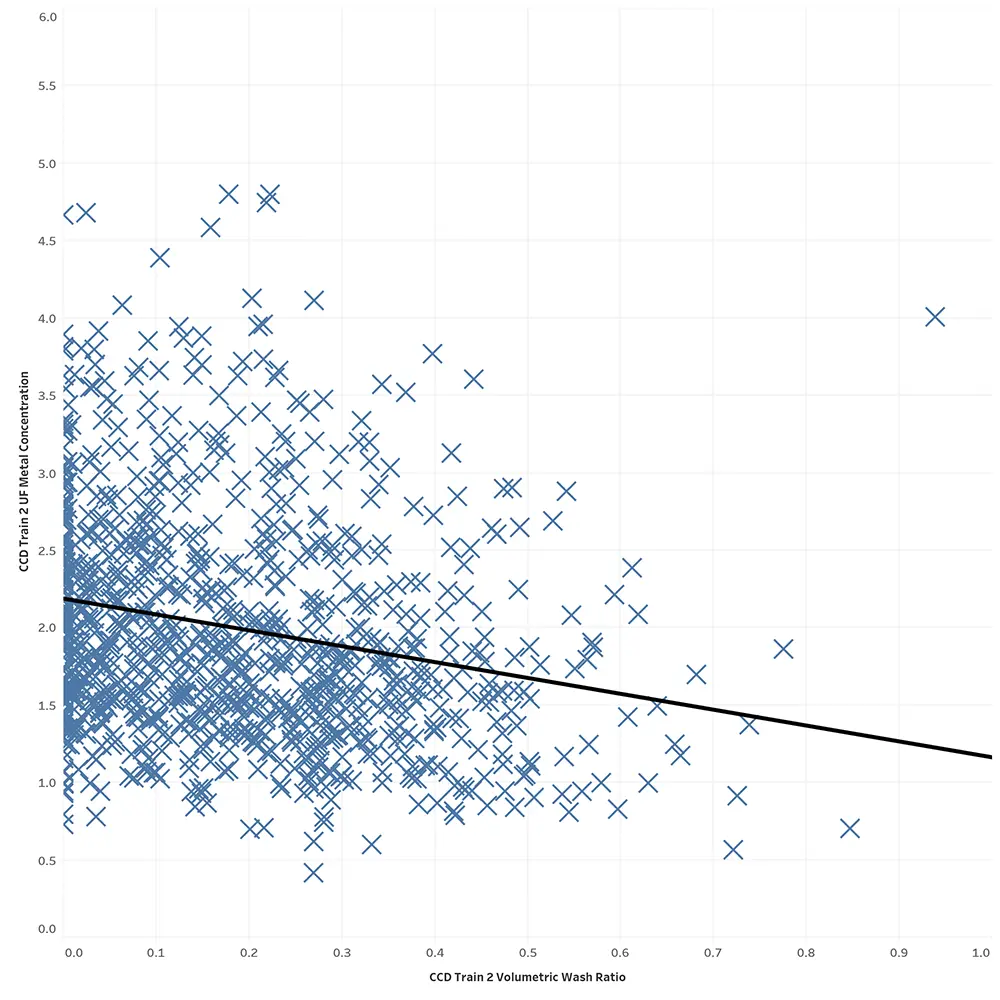
Finally, Figure 4 shows the relationship between wash ratio and underflow metal concentration for CCD Train 2, indicating that low wash water flow is related to higher underflow metal concentrations.
Case Study 2: Comparing measured and calculated data to identify outliers
The second case study comes from the same hydrometallurgical plant as Case Study 1, except this time the goal is to use the relationship between measured and calculated data to identify outliers.
Figure 5 shows the measured and calculated metal concentration values in seven related plant streams over time. These streams can be used to conduct a mass balance over a set plant area, so should interact as such. It is clear from the graphs that the measured and calculated values deviate at different points, but it is not clear whether these deviations are outliers that should be corrected, or realistic values resulting from changes in the way the plant was operating.
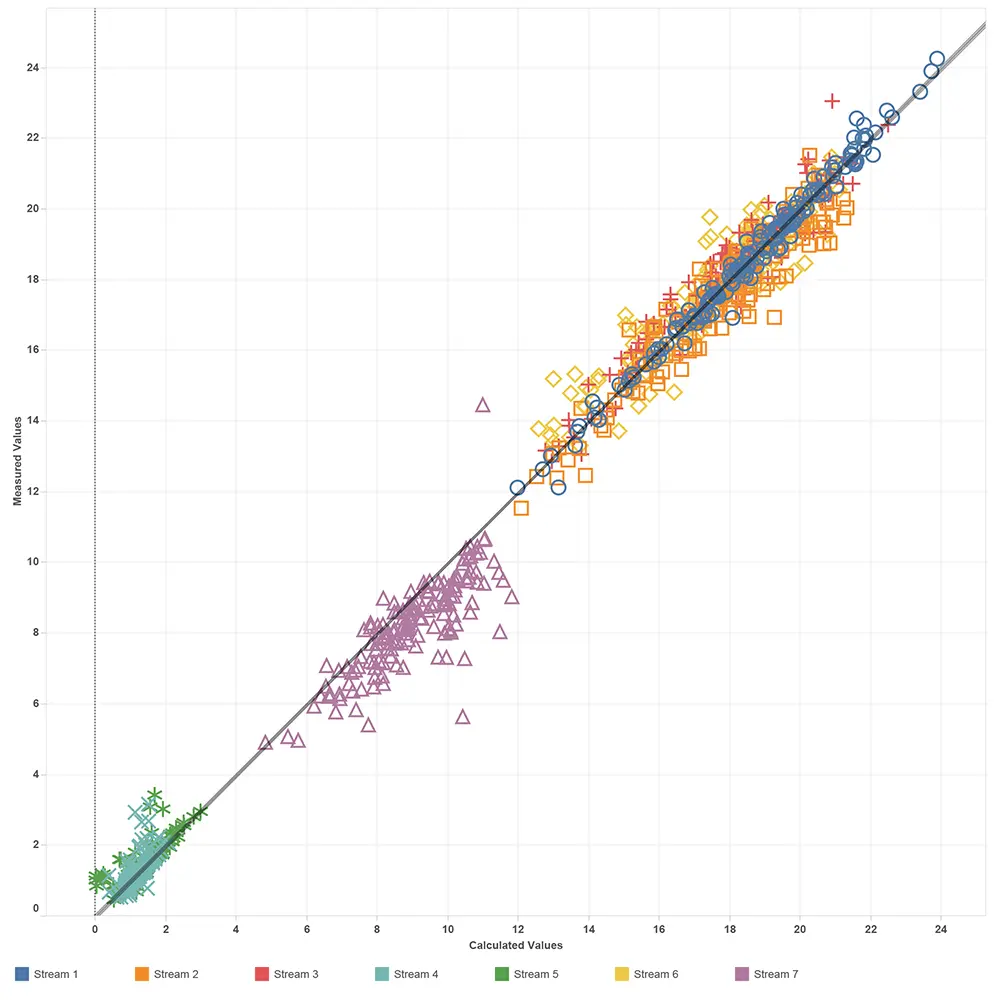
A method for identifying outliers is to compare the measured and calculated values for all the assay results on the same chart, as shown in Figure 6 (below).
Figure 6 shows that the measured and calculated values tend to agree and that these are relatively closely clustered together for each of the different streams. However, it is possible to see trends where values skew higher or lower, and to identify clear outliers. An example of this is the Stream 7 result circled in Figure 6.
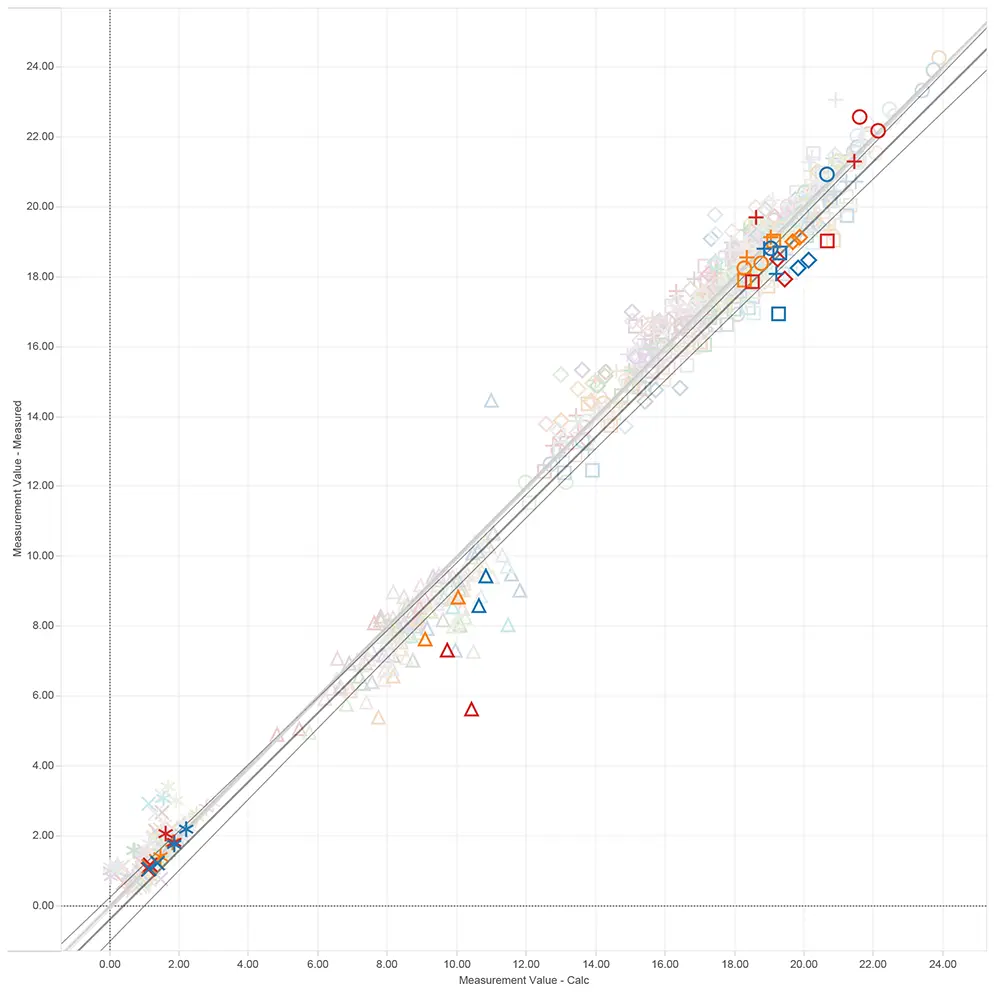
It is also possible to analyse the same data in a different way, grouping data points by date and plant stream. The purpose of this is to see whether deviations occurred in multiple streams at the same time, indicating a real event in the plant.
In the case of the outlier identified in Figure 6, further analysis shows that the other assays collected on that day, the day before and the day after all align closely when comparing measured and calculated. This indicates that the single value was an outlier.
Comparatively, Figure 7 shows a case where a number of apparently outlying values occurred in close succession, and in multiple streams. In this scenario, it is not possible to dismiss these results as outliers, meaning that further investigation into the cause of this difference is warranted.
5 potential applications for this modern approach
In addition to validating assay results, there are also many other potential applications where this procedure of comparing against a calculated dataset could be deployed.
1. Validate sampling processes
The new approach can be used to identify quality control issues with sample assay results, which can then be used to investigate the quality assurance associated with sample collection and analysis processes. It would be expected that certain QAQC problems would be associated with certain deviations between measured and calculated data, meaning that issues could be diagnosed with ease and consistency.
The broad nature of this modern approach means that all other potential issues (or real plant changes) can be accounted for when investigating plant sampling QAQC. Other QAQC data, such as external check assays, standard solutions and blanks can also be collected in the same database and included in the comparison.
All of this data can also be used to confirm that the sampling methodology selected is appropriate for the stream in question – whether the minimum sample size is being achieved, relative to the particle size and flowrate.
2. Validate plant instrument calibrations
Comparing measured plant instrument data against its related calculated data can also be used to recommend instrument calibrations, and to validate completed calibrations. This works by effectively cross-checking the instrument data against all other instruments in the same area, and also against entirely different data types such as assay data. This is all based on the same ‘consensus’ approach used to validate assay data, where the dynamic mass balance provides a means of checking whether combinations of multiple data points all balance.
Particularly, this process can be used to measure instrument drift over time, as the deviation between measured and calculated values will increase with time. The result of instrument drift or poor calibrations will often result in elevated or depleted inventories that do not align with actual plant operation. These key inventories can be easily identified and validated, and the source of the discrepancy can thus be investigated.
3. Reconcile with mining/geology data
The modern approach to metallurgical accounting generates such a vast amount of data, such that it can be used to compare against other related datasets. The most prescient of these is the feed reconciliation process, where metallurgical accounting data is compared against the mass and grade information from the mine.
This process has already been completed at multiple operations, where calculated metallurgical accounting data is compared against ROM data. These differences can then be used to investigate the source of deviations and validate the mining/geology sampling technique, as well as the estimation or measurement of bulk ore movements. It could also be extended further upstream to provide validation to block modelling and even resource estimation.
Reconciliation between individual plant areas can also be performed in a similar manner, for example, between concentrating, leach and refinery areas where there may be misalignment at either end of a boundary between areas.
4. Cross-check final product data
Often, the measurement of final product for payment is controlled by the customer, particularly if that product is an intermediate concentrate. This can mean that it can be difficult to question situations where the customer or a third party determines that the material for sale is different to what was thought to have been produced.
Access to data extracted from a digital twin allows for an understanding of elemental flows that cannot be directly measured, meaning the final product data can be reconciled against calculated elemental flows through the plant to identify losses or issues in final product assay sampling and analysis.
5. Validate the model against itself
A final application is the potential for validation of the dynamic model against itself, by comparing the results from different calculation methods for the same thing.
There are multiple ways to determine how the model uses the information it is given. Choices are made to use one variable as an input instead of another, to avoid over-constraining the calculations. A single calculation method is selected for use in the daily operation of the dynamic model.
An example is using the ‘Two Product Formula’ to determine the mass split of solids in a flotation circuit. This is based on the use of assay grade results from the feed, concentrate and tails samples, usually for the primary metal. However, it is also possible to use assay results from a secondary metal or other species to determine the split. In some plants, it may also be possible to determine the mass split in the flotation circuit using instrumentation (weightometers, flowmeters and density gauges) up and downstream.
In all, there may be as many as four different ways to calculate the same thing. These results can then be compared to each other to see whether there is a consensus between them and determine whether the calculation method that was originally chosen is the best for the application.
What are the governance frameworks for metallurgical accounting?
Increasingly strict governance and compliance frameworks are making accurate metallurgical accounting essential for the mining and resources sector.
It’s important for mining organisations to tailor their metallurgical accounting governance frameworks based on a combination of these industry standards, regional regulations and internal policies to meet specific operational and reporting requirements.
Here we explore some of the main governance frameworks including:
- Sustainability reporting frameworks
- AMIRA P754
- Sarbanes-Oxley Act of 2002 (SOX)
- The UK Corporate Governance Code
- The King Report on Governance for South Africa
- ASX principle 4
- The SAMREC Code and JORC Code
- The International Council on Metals and Minerals (ICMM)
Primary sustainability reporting frameworks
There are varying sustainability reporting rules and regulations in place across the world. However, in response to a pressing need for simpler and more consistent rules to manage global markets, the majority of these are rolling up under three main frameworks that mining and minerals leaders will need to understand:
- ISSB: International Sustainability Standards Board
- CSRD: EU Corporate Sustainability Reporting Directive
- US SEC: Securities and Exchange Commission
Between them these three umbrella frameworks cover many global markets and, therefore, large industrial enterprises are likely to be impacted by one, two or all three of these frameworks. Other legal requirements such as the Carbon Border Adjustment Mechanism (CBAM)3 and the Safeguard Mechanism Reforms will also impact certain jurisdictions.
Collectively, the primary sustainability frameworks demand robust environmental measurement and reporting of climate and nature disclosures, environmental impacts and risks, emissions, energy consumption, material usage and the impact of environmental considerations with financial reporting.
To meet these governance requirements, metallurgical accounting practices will need to evolve to incorporate advanced technologies, real-time data acquisition and continuous improvement methodologies.
Now is the time to ensure the calculations behind metallurgical accounting that derive emissions, water, power consumption and other sustainability metrics are accurate, transparent and auditable.
AMIRA P754 Code of Practice for Metal Accounting
The AMIRA P754 Code of Practice for Metal Accounting is a set of governance guidelines released by the independent, global, not-for-profit organisation AMIRA, that represents members from the resources industry.
Recognising the crucial role of accurate, auditable and transparent metal accounting data in the financial accounts of mining and metallurgical companies, it outlines a set of 10 standardised metal accounting practices for improved corporate governance.
This initiative initially gained momentum in the wake of significant financial scandals, highlighting the need for tighter reporting standards. Today, AMIRA P754 has gained widespread adoption as a global standard for metal accounting within the industry and serves as the foundation for audits of metallurgical plants globally.
To comply with governance components of modern environmental, social and governance (ESG) requirements, mineral processing plants must showcase their adherence to AMIRA P754. The 10 practices typically form the basis of defined business requirements for an effective metal accounting solution.
Why traditional methods are not compliant with AMIRA P754
When the AMIRA standard was first developed, it was at a time where spreadsheets were almost the only option for metallurgical accounting. The principles aimed to set a minimum standard.
At Metallurgical Systems, we’ve found that spreadsheets are not compliant with AMIRA P7544, and that code should be reviewed in line with proven modern technology to address several critical weaknesses with traditional methods:
Lack of traceability to source data:
The AMIRA P754 Guidelines states: ‘2. The system must be consistent and transparent and the source of all input data to the system must be clear and understood by all users of the system. The design and specification of the system must incorporate the outcomes of a risk assessment of all aspects of the metal accounting process.’
Spreadsheets and some basic SDR solutions cannot provide traceability back to the source dataset. Simply labelling a column and assuming the data is transferred accurately is not transparent. Even spot checks cannot be considered a reasonable check due to the volume of data and the ability to omit or correct values. There is often no way to determine that the data being analysed reflects source data. There are some tools that can provide some level of integration, but even that data can be changed without record/audit trail.
Spreadsheets cannot provide the required traceability while utilising all the necessary data, with transparent data handling rules.
Lack of data verification:
The AMIRA P754 Guidelines also state: ’7. The system must generate sufficient data to allow for data verification, the handling of metal/commodity transfers, the reconciliation of metal/commodity balances, the measurement of accuracies and error detection, which should not show any consistent bias.’
Although spreadsheets can be configured to include calculations, they are not capable of storing enough source data to complete detailed verification. They are also incapable of generating sufficient cross check data without any user intervention and in fact rely on user discretion which is a more significant issue.
Key person risk
While even the most comprehensive spreadsheets won’t fully meet the requirements of AMIRA P754, organisations that do use complex integrated workbooks often rely on a single person to understand how they work. This presents a significant governance risk that is a challenge to mitigate. Metallurgical teams are small to start with, and not all metallurgists have strong programming skills.
Limitations of statistical based solutions
Statistical based reconciliation has been used within the industry for a long time. It provides users with a single value for a period, typically one month. This technology can be used to report data.
The issue is that statistical based reconciliation has several weaknesses and accommodates broad assumptions that make it less rigorous than digital twin reconciliations.
- Low process resolution
- Low data resolution
- Arbitrary application of standard deviations to key streams
- Assumption that errors are based on a normal distribution
- Cannot calculate plant inventory
- Often assume no inventory change, although some products accommodate opening and closing inventories
- Often use arithmetic averages instead of weighted calculations
Advantages of modern digital tools
Best practice metallurgical accounting technologies available to the industry today, such as Metallurgical Systems MI Core® software, overcome the limitations of spreadsheets and traditional methods to meet AMIRA P754 and other evolving governance frameworks.
Full traceability of source data:
- All data is extracted from source data systems automatically. No user interaction required. The data is loaded a minute after the period is completed, or as soon as the laboratory approve the data.
- The extraction process is detailed in the interface specification that is attached to the dataset. Therefore, it makes it clear where the data comes from and how.
- Every measure point in the system has a source dataset tag with activation and expiry date listed (as the description and location within the process can sometime change). This makes it very clear where data is sourced and for what period it was used.
- When the data is extracted from a source data system, MI creates a CSV and archives it before loading the data into the database. The archived CSV is available to download via the web control panel.
- The quality of the data loaded is automatically analysed and reported (data quality reports) and allows for complex (yet transparent) data handling with consistent, clear rules. For example, range checking is standard, as expected, although the solution goes way beyond that where it will report on how many assays were missing based on the sample matrix for each point in the process. This also removes the requirement to have a standard interval for all assays and still allow for weighted calculations.
- Any subsequent reloading of the data from source data systems is logged with which user initiated it, when, for how long and most importantly the details relating to what data changed between loads. It also keeps all the attempts as a CSV as well.
- Any interaction with the data within the solution is documented in an activity feed which lists the user. Users can check any activity that relates to any aspect of the software.
- MI Core® can automatically extract over a million rows of data per day for multiple sources.
Verifiable data quality:
MI Core® software automatically assesses the data quality individually, by physical location and by phenomena. This generates several plots that show if there is bias or instability with respect to a specific sample or instrument, with all measurements in an area or with a specific assaying method. It can also show if there is a bias over time or for a specific period. The solution also assesses the measured data against the data generated by the digital twin (dynamic model) referred to as calculated data. By comparing the measured result against the calculated result for each measure point we can determine the accuracy of the data in context of the process. The data is available to all users of the solution and does not require any configuration. If there is a significant and consistent deviation, the software can provide a suggested value that reflects actual plant performance based on data upstream and downstream in the process.
Precise site-wide mass balance:
MI Core® can calculate a precise balance on a basis less than monthly primarily due to the fact a detailed site wide mass balance, including calculation of inventory, is reported for every single hour. This is where the definition of precision comes into play. Technically, within the AMIRA guidelines, an inventory is not precise unless it is also subject to physical stocktake. Herein lies a problem; sampling the inventory of the plant is a time-consuming process that normally spans an entire shift and is also subject to errors. Consider gold on carbon as an example.
With MI Core®, users can sample particular areas, and the samples assigned to the hour that they were obtained. This gives engineers and metallurgist an opportunity to validate inventory on a more frequent basis. This can provide constant targeted inventory validation without the workload surge in the lab for end of month processes. It also can address double count issues that occur in normal stocktakes. For example, in large concentrators product thickener inventories may be taken in the morning, for end of month, then over the next 16 hours emptied and filtered with the production also recorded within the same month. Rarely are metallurgist aware of the exact time the sample was taken. Using MI, users would see that a thickener was emptied and at what time.
Sarbanes-Oxley Act of 2002 (SOX)
SOX is a significant piece of legislation (Public Law 107-204) signed into law in 2002 in response to high-profile accounting scandals at major American corporations like Enron, Tyco International and WorldCom.
SOX brought about substantial changes to financial practices and corporate governance in the United States, with a primary aim to safeguard investors by enhancing the accuracy and reliability of corporate disclosures.
The Act, consisting of eleven titles, imposes a ‘comply or else’ approach, mandating all companies, regardless of size, to adhere to its provisions. Key compliance requirements under SOX include:
- CEOs and CFOs hold primary responsibility for the accuracy of reports filed with the SEC. They are required to certify financial reports, ensuring completeness, accuracy and the effectiveness of underlying controls.
- Management is obligated to assess the effectiveness of internal controls over financial reporting.
- External auditors must attest to management’s representations and report directly to the Audit Committee.
- Companies’ auditors are restricted from providing consulting services for the same company.
- Severe penalties, including fines and imprisonment up to 20 years, are prescribed for intentionally altering, destroying or falsifying records to obstruct legal investigations.
- Accountants face fines and/or imprisonment for up to 10 years if they knowingly violate the requirements for maintaining audit or review papers for a period of 5 years.
In essence, SOX sets stringent standards for financial reporting, internal controls and auditor independence, aiming to restore confidence in the integrity of corporate disclosures and protect the interests of investors.
The UK Corporate Governance Code
The UK Corporate Governance Code was established in response to governance failures linked to major corporate scandals in 1992, with subsequent versions released by the Financial Reporting Council (FRC) in 2010 and 2012.
Characterised by the ‘comply or explain’ approach, the Code mandates companies with premium listings on the London Stock Exchange to disclose compliance and reasons for non-compliance. While certain provisions are inapplicable to companies below the FTSE 350, they are encouraged to adopt the Code’s principles.
Embracing five key principles – leadership, effectiveness, accountability, remuneration and relations with shareholders – the Code outlines several requirements relevant to this context:
- Each board must have an audit committee consisting of non-executive directors.
- The board should offer a fair, balanced and understandable assessment of the company’s position and prospects.
- Formal and transparent arrangements must be established for applying corporate reporting, risk management and internal control principles, maintaining a suitable relationship with auditors.
- The audit committee is responsible for monitoring the financial statements’ integrity and reviewing significant financial reporting judgments.
In addition to Listing Rules ‘comply or explain’, the Code mandates specific disclosure requirements. Non-compliance may result in legal liability for the board or individual directors. The ‘comply or explain’ principle recognises the possibility of justifiable alternatives in specific circumstances, requiring clear and careful explanations to shareholders, including details on the limited deviation period and the company’s intent to return to Code conformity.
The King Report on Governance for South Africa and the King Code of Governance Principles (King III)
The King Report on Governance for South Africa, accompanied by the King III Code, was introduced in September 2009 to replace the King II Code by 1 March 2010. The revision was prompted by changes in South African legislation, especially the Companies Act No. 71 of 2008, increased regulations in certain jurisdictions and evolving global corporate governance standards.
Unlike the ‘comply or explain’ principle in the previous version, King III adopts the ‘apply or explain’ approach, applicable to all entities regardless of their incorporation or establishment form.
Key principles outlined in King III, relevant to this discussion, include:
- The board should serve as the focal point and custodian of corporate governance.
- The board and its directors are obligated to act in the company’s best interests.
- Ensuring the company has an effective and independent audit committee is a responsibility of the board.
- The audit committee should review and comment on financial statements within the integrated report.
- External auditors must be engaged by the audit committee to provide assurance on summarised financial information.
- The audit committee is responsible for recommending the appointment of external auditors and overseeing the external audit process.
In relation to the three governance codes discussed in this context, it is suggested that audit committees, external auditors and executive management of mining companies may exhibit variations based on their primary listing location and/or physical operations.
Recognising the significance of accurate metallurgical accounting, particularly in metal inventories, the AMIRA P754 research team emphasised the need for such accounting to meet financial accounting standards in terms of auditability and transparency.
The mining and metallurgical industry had acknowledged a gap in accounting practices, prompting the importance of conducting metal accounting at a level consistent with acceptable corporate governance standards, as highlighted by AMIRA in 2007.
ASX Principle 4
Before 2014, businesses listed on the Australian Stock Exchange (ASX) were mandated to uphold integrity in financial reporting, as per the ASX Corporate Governance Principles and Recommendations. However, a notable shift occurred with the revision of ASX Principle 4, altering the expectation to ’safeguard integrity in corporate reporting’.
This change holds significance as it now requires companies to report accurately, considering their key assets rather than solely focusing on financial performance. This convergence of ASX and AMIRA P754 governance requirements compels the compilation of intricate performance data across the plant, incorporating historical context.
To ensure compliance with ASX Principle 4, it is now essential for a plant’s production and metal accounting reports to undergo an annual external audit when finalising financial and corporate reports. This audit should be conducted by a qualified metal accounting expert or metallurgist/engineer, known as a ’competent person’, rather than a financial chartered accountant. The use of proven and accredited software tailored specifically for minerals processing is emphasised.
This significant change underscores the shift toward accurate reporting based on key assets, not just financial details, within the ASX governance principles. Consequently, reporting of production is now encompassed by these principles. Additionally, it is emphasised that spreadsheets are inadequate for reporting where governance standards are required.
SAMREC Code and the JORC Code
The SAMREC Code (2009) and the JORC Code (2004) mandate public companies to annually review and publicly report on their mineral resources and ore reserves. Additionally, any material changes in these resources or reserves must be promptly reported.
Given that processing plants typically receive measured mineral resources for further beneficiation, the primary objective of mineral reserve estimation is to ensure the successful extraction and delivery of mineral resources for processing at the estimated grade. Mining reconciliation involves comparing estimates, such as mineral resource or ore reserve models, with measurement information or official production from a processing plant.
International Council on Metals and Minerals (ICMM)
The International Council on Mining and Metals (ICMM) is a global industry association representing leading mining and metals companies.
It aims to enhance the sustainable development performance of the mining and metals industry by establishing principles and guidelines.
Three of the10 ICMM Mining Principles5 are particularly relevant to metallurgical accounting and are outlined below:
- Ethical Business Practices and Corporate Governance: Emphasises ethical standards and transparent governance in metal accounting, ensuring credibility and responsible resource management.
- Effective Risk Management: Encourages robust risk-management strategies in metal accounting based on sound science and stakeholder considerations, contributing to sustainable development.
- Stakeholder Engagement and Transparent Reporting: Highlights the importance of engaging stakeholders and transparently reporting progress in metal accounting, promoting responsible practices and industry credibility.
The metallurgical accounting challenge: A lack of accurate data and digital tools
The inaccuracy and inconsistency of metallurgical accounting methods in the mining and minerals industry has been a widely discussed challenge for more than 30 years.
Effective metallurgical accounting, crucial for operational efficiency, decision-making, stakeholder reporting, compliance and sustainability, depends fundamentally on quality data. Operations require access to large volumes of granular source data contextualised across plant processes, coupled with advanced digital tools like dynamic process simulation.
However, many operations still rely on manual and disconnected processes, lacking the necessary digital tools and metallurgical software. While some organisations are making great progress, others still rely on aging legacy systems and manual processes that make meeting metallurgical accounting requirements increasingly difficult.
Without a data-driven sustainability platform, complying with evolving reporting standards and implementing effective decarbonisation strategies becomes impossible.
To address gaps in digital platforms or analytics expertise, organisations can accelerate the process by engaging a specialist consultant early for advice on technology, data, compliance or reporting.
Introducing Metallurgical Intelligence (MI)®
Proven for over a decade in mining and minerals plants globally, Metallurgical Intelligence® (MI) is a metallurgical accounting and reporting platform that captures, centralises and consolidates huge amounts of disparate data into a digital twin of your operation’s processing operations.
MI’s core functionality powers metallurgical accounting, process optimisation and production reporting. On top of this, it has in-built world-leading capabilities around auditable reporting for direct and indirect GHG emissions, energy and water consumption – ideally suited to meet today’s evolving governance frameworks.
One of the most powerful features of the MI suite of software is that it connects directly to source data – and captures and includes over 20,000 measure points – to give you a deep understanding of your plant by simulating activity in two ways: dynamic simulation and steady state simulation.
Dynamic simulation: Understand your plant’s history
Dynamic simulation uses time as a dimension. It allows us to show how a plant is behaving and how it is responding to changes over time. This makes it a very useful tool for mimicking plant operations to examine them in more depth.
In MI Core®, dynamic simulation is used when looking at the past – typically the last 24-hours. The system takes real plant data from a vast number of different points, such as instrument logs and lab assays, and uses these as inputs. It does this at two-minute intervals for that 24-hour period, effectively recreating the plant’s operation for that day.
The output from this is a highly detailed dataset that grows to thousands of data points. It captures things that cannot be measured easily, like inventory changes or mass transfer. It can also highlight when data coming from the plant just doesn’t add up.
Instrument and laboratory data can certainly be used to draw a rough sketch of what happened in the plant. However, dynamic simulation provides the detail, and adds the colour and rendering to paint a true picture of plant performance.
Steady state simulation: Look into the future
Steady state simulation does not use time as a dimension. Instead, each simulation represents a fixed period. However, by removing time as a variable, it’s possible to capture more detail in other areas. Particularly, it means that we can utilise more complex control relationships to find answers to questions. A steady state simulation can handle uncertainty.
In MI Scenario®, steady state simulation is used when looking at the future, while maintaining a link to the past. Our system allows users to select snapshots of real historical plant data as the basis for the input data, but then invites users to create scenarios based on this. There is no limit to the number of scenarios that can be run, enabling much more accurate and informed decision-making.
Process optimisation, variable feed compositions, stress tests or even plant configuration changes can all be investigated using MI Scenario®. The results from these simulations can also be automatically transferred to MI Core® for use as budget or forecast figures.
To learn how our modern metallurgical accounting solutions can be used to optimise operations, meet new mandatory finance-grade sustainability reporting regulations and accelerate digital transformation, contact our team of engineers, metallurgists and technology professionals at +61 2 7229 5646 or info@metallurgicalsystems.com
Related resources
References:
- AMIRA website, accessed Feb 2024
- Book: Morrison, R D, 2008a. Motivation for and benefits of accurate metal accounting, in An Introduction to Metal Balancing and Reconciliation (ed: R D Morrison), pp 3-23 (Julius Kruttschmitt Mineral Research Centre: Indooroopilly)
- Metallurgical Systems, How The EU Carbon Border Adjustment Mechanism (CBAM) impacts your business, 2023
- Metallurgical Systems, Why Excel is not AMIRA P754 compliant, 2021
- ICMM, 10 ICMM’s Mining Principles respond to evolving societal expectations of the mining and metals industry, accessed 2024
About the authors
This article has been collaboratively authored by the team at Metallurgical Systems, and fact-checked and authorised by Managing Director and industry specialist John Vagenas.


