Accurate Scope 3 tracking is only possible with digital tools
Across the world, governing organisations and markets are demanding end-to-end transparency of emissions across the supply chain. Beyond direct emissions (Scope 1), they now require granular disclosures of indirect electricity and other indirect emissions (Scopes 2 and 3) upstream and downstream.
With Scope 3 emissions accounting for a majority of emissions in energy-intensive industries like mining and resources, it is critically important to accurately track them to both hit reduction targets and meet compliance obligations.
Driven by the International Sustainability Standards Board (ISSB) and leading EU bodies – with input from 20+ international governing agencies – soon to be mandatory global standards will require public annual reporting on Scope 3 emissions and demonstrated strategies to reduce them.
Other legislation will demand quarterly disclosures on carbon, water, waste, energy and other sustainability indicators, increasingly down to product-level reporting.
Many organisations in the mining sector are already falling behind on the basics of capturing, measuring and reporting sustainability and emissions data, with a global survey of industry executives finding that 91% fail to measure emissions comprehensively1. As a result, this new legislated accountability brings significant complexity and risk, making it a key and urgent priority.
Now is the time for leaders to take the actions needed to meet Scope 3 compliance regulations, and protect and grow their operations, financials and reputation.
Drawing on 10 years of experience in process engineering, data-led software and ESG reporting in the resources sector globally, in this guide we explain Scope 3 reporting requirements and how they are likely to impact mining and resources organisations.
What are Scope 3 emissions (upstream and downstream)? What are the latest market developments? How can mining and resources organisations prepare for Scope 3 reporting? What digital tools are available to fast-track Scope 3 reporting?
Contents
- What are the methods used to calculate sustainability metrics at a product level?
- How to calculate Scope 3 emissions in mining and resources
- Mining case study: Enabling Scope 3 reporting at a granular level
- The Scope 3 challenge: A lack of digital data, measurement and analytics tools
- Opportunities to lead the way
- Scope 3 reporting is only achievable with effective digital software
- Take control of your Scope 3 reporting compliance
- About Metallurgical Systems
- About the Authors
- References
What are Scope 3 emissions?
Scope 3 includes all indirect emissions that are a consequence of the activities of the company but occur from sources not owned or controlled by the company.
The Carbon Disclosure Project (CDP)2 estimates that, on average, Scope 3 emissions make up 75% of an organisation’s GHG emissions, with the supply chain being a major contributor. For example, extraction and production of purchased materials, transportation of purchased fuels and use of sold products and services.
A large proportion of Scope 3 emissions for mining and resources facilities come from the production and delivery of reagents or raw materials produced by external parties and suppliers. However, Scope 3 emissions also come from sources that are more difficult to monitor, such as business travel, delivery, use and processing of sold products and the impact of waste and byproducts.
These Scope 3 emissions are often calculated using a combination of unclear assumptions, default input values and formulas that cannot be easily audited, validated or traced back to the original source.
Having access to accurate data enables organisations to meet the necessary reporting requirements, understand their operation and proactively work to reduce Scope 3 emissions.
Scope 1
Direct Emissions
Emissions from sources owned or controlled by the company directly, as well as emissions from chemical production in company owned or controlled process equipment.
Scope 2
Electricity Indirect Emissions
Emissions from the generation of purchased electricity consumed by the company, and emissions that physically occur at the facility where the electricity is generated.
Scope 3
Other Indirect Emissions
All other indirect emissions that are a consequence of the activities of the company, but occur from sources not owned or controlled by the company.
Scope 3 covers upstream and downstream emissions
To capture an organisation’s full carbon footprint, Scope 3 covers the entire supply chain covering product emissions before, during and after manufacture and distribution.
Upstream emissions relate to emissions associated with the production and transportation of materials and components used in their products that occur before the company takes ownership.
Downstream emissions pertain to emissions resulting from the use and disposal of the company’s products by consumers, happening after the company has sold or delivered them.
Upstream
- Purchased goods and services
- Capital goods
- Fuel-and energy-related activities
- Upstream transportation and distribution
- Waste generated in operations
- Business travel
- Employee commuting
- Upstream leased assets
Downstream
- Downstream transportation and distribution
- Processing of sold products
- Use of sold products
- End-of-life treatment of sold products
- Downstream leased assets
- Franchises
- Investments
Why is Scope 3 measurement important and urgent?
Up until recently, emissions reporting rules have largely been vague, ad-hoc and voluntary – especially when it comes to Scope 3. However, the market’s rapid shift towards sustainability transparency, supported by significant global policy developments, means that accurately measuring Scope 3 emissions can no longer be ignored.
Globally, governments and regulators are developing specialised reporting requirements for the mining, minerals and resources sectors that are becoming broader in scope and requiring more detail and accuracy than ever before. Their goal is to create green supply chains with end-to-end carbon emissions reductions.
With Scope 3 emissions covering a large proportion of heavy industries’ emissions, pressure is growing from investors, communities and governments for the sector to take a strategic and consistent approach to their reduction.
Accurately measuring and reporting on Scope 3 emissions is not only critical for compliance, but also an essential part of setting and meeting emission reduction targets, investor reporting, transitioning to a sustainable future and keeping up with greener competitors. Rating agencies will also now expect more detailed, accurate and quantitative information that is typically difficult to obtain from the systems of many mining and resources organisations.
Research reported in ESG Today3, shows that public companies reporting on at least some Scope 3 emissions has increased to 35% (up from 30% seven months prior) with 44% of companies setting decarbonisation targets (up 8% in seven months).
The findings also show that despite better disclosure and well-intentioned targets, direct emissions had not materially declined. On top of this, they reported that many targets did not cover the entire value chain, relied on carbon offsets, lacked third party validation or were not aligned to net zero goals.
The Net Zero Tracker4 also underlined the wide gap between aims and action, reporting that while most public companies do have net-zero targets, the majority are not yet meeting minimum reporting standards. In terms of Scope 3 the gap is even wider, with just 38% of the companies tracked saying they measure all value-chain emissions.
Even though disclosure has been voluntary up until now, the number of companies publishing a sustainability report has been growing steadily over the past decade, with 79% of the top 100 countries in each company surveyed by KPMG5 producing a report. Businesses that aren’t reporting even at a broad level risk falling behind in a market that demands transparency, as well as facing an uphill battle to deliver the granular data now required to report on Scope 3 emissions.
Complying with new standards and expectations will require the mining and resources sector to improve the availability, rigour, trust and reliability of data. Companies that have not yet begun calculating their Scope 3 emissions are already falling behind.
What are the Scope 3 reporting requirements?
The specifics of an operation’s industry, products and locality will determine precisely what needs to be measured and reported on, but with broad global frameworks and local regulations heading in the same direction, mandatory Scope 3 reporting is inevitable.
From 2023, organisations in many sectors such as mining and resources will be required to capture, analyse and provide granular reporting on a range of sustainability indicators, including GHG emissions (across Scopes 1, 2 and 3), water, energy, air quality, waste hazardous materials and nature-related risk factors across the operation and supply chain.
There is a push for a single global standard, however major economies like the USA and EU are developing climate reporting systems separately. While the three major climate disclosure standards and frameworks do have areas that are not aligned, they do feature many areas of interoperability and consistency, and they all include mandatory Scope 3 measurement elements.
These include:
- International Sustainability Standards Board (ISSB)
- EU Corporate Sustainability Reporting Directive (CSRD)
- Securities and Exchange Commission (SEC)
All three of these frameworks consider input from the Task Force on Climate-Related Financial Disclosures (TCFD) and the Greenhouse Gas Protocol (GHGP). Here, we take a deeper look into what each of the main standards have to say specifically about Scope 3.
ISSB and Scope 3
The ISSB has proposed two international standards for sustainability reporting: IFRS General Requirements for Disclosure of Sustainability-related Financial Information (overarching principles) (IFRS S1) and IFRS S2 (theme topical specific) Climate-related Disclosures (IFRS S2). The ISSB released IFRS S1 and IFRS S2 on 26 June 2023, with the intention to create a global baseline for sustainability-related financial disclosures.
Both standards are based on the four pillars used in the Task Force on Climate-Related Financial Disclosures (TCFD) framework; governance, strategy, risk management and sustainability-related metrics and targets – referred to in the standards as the ‘core content’.
All countries that adopt ISSB (which includes IFRS S1 and IFRS S2) will require Scope 3 measurement in accordance with the GHG Protocol Corporate Standard6.
IFRS S2 is the first thematic standard that outlines the requirements for entities to disclose information around climate-related risks and opportunities and how this may affect the prospects of an organisation over the short, medium and long terms. The Sustainability Accounting Standards Board (SASB) industry-based disclosures are to be considered when quantifying and accessing these risks and opportunities.
The two standards are designed to disclose decision-useful information to capital markets and securities regulators and require information about all material sustainability-related and climate-related risks and opportunities that could reasonably affect the cash flow of an entity, access to finance and the cost of capital.
In terms of Scope 3, The IFRS2 Sustainability Disclosure Standard7 states that:
“…an entity shall disclose information about its Scope 3 greenhouse gas emissions to enable users of general-purpose financial reports to understand the source of these emissions. The entity shall consider its entire value chain (upstream and downstream) and shall consider all 15 categories of Scope 3 greenhouse gas emissions, as described in the Greenhouse Gas Protocol Corporate Value Chain (Scope 3) Accounting and Reporting Standard (2011).”
The GHG Protocol8 statement published in June 2023 further underlines the importance of Scope 3 emissions disclosure:
“IFRS 2 requires companies to disclose absolute gross greenhouse gas emissions generated during the reporting period, measured in accordance with the Greenhouse Gas Protocol, classified as scope 1 emissions, scope 2 emissions, and scope 3 emissions. The ISSB’s requirement of scope 3 disclosure in IFRS S2 further illustrates the key role that scope 3 emissions play to measure, plan and track companies progress toward science-based and net-zero targets in line with the global 1.5°C goal.”
EU CSRD and Scope 3
The European Parliament and Council has gone even further than the ISSB. The European Council9 has legislated the CSRD from January 2023, with several member states already introducing the CSRD into national law.
The latest enhanced EU CSRD requires companies to make extensive disclosures about sustainability performance and related strategic implications, as prescribed by the European Sustainability Reporting Standards (ESRS). ESRS E1 (Climate Change) requires that Scope 3 is measured, considering the principles of the GHG Protocol Corporate Value Chain (Scope 3) Accounting and Reporting Standard and screen its total scope 3 GHG emissions based on the 15 Scope 3 categories identified by the GHG Protocol.
EU CSRD and Global Reporting Initiative (GRI) have worked together with a big focus on interoperability between the frameworks and double materiality; financial impact, as well as impact to climate, environment and society. This extends to scope 3 disclosures.
In July 2023 the European Commission10 published the final text of its first set of ESRSs, with disclosures for some companies required from January 2024.
The European Financial Reporting Advisory Group’s (EFRAG) draft standards specifically call out Scope 3 emissions reporting:
“The undertaking shall disclose its gross indirect Scope 3 GHG emissions in metric tons of CO2 equivalent. The principle to be followed under this Disclosure Requirement is to provide an understanding of the GHG emissions that occur in the undertaking’s value chain beyond its Scope 1 and 2 GHG emissions. For many undertakings Scope 3 GHG emissions are the main component of the GHG inventory and an important driver of their transition risks.”
CSRD simplifies today’s most topical and pressing environmental matters into the following 5 standards:
- ESRS E1 Climate change
- ESRS E2 Pollution
- ESRS E3 Water and Marine Resources
- ESRS E4 Biodiversity and ecosystems
- ESRS E5 Resource use and circular economy
Each standard contains its own disclosure requirements and data points.
ESRS E1 will require data points and reporting on Scope 3 and total GHG emissions, which will cover (i) upstream purchasing, (ii) downstream sold products, (iii) goods transportation, (iv) travel and (v) financial investments.
The first set of standards are sector-agnostic. However, it’s expected that the second set of reporting standards11, will be sector-specific. Sectors likely to be included are oil and gas, mining, agriculture, farming, and fisheries, energy production and utilities among others.
SEC Climate Disclosure Rules and Scope 3
Under the SEC proposal, issuers would be required to disclose their Scope 3 emissions if they are material or if reduction targets had been set for them. It has not been confirmed when the rules are likely to take effect.
The SEC Factsheet, Enhancement and Standardization of Climate-Related Disclosures12, outlines the proposed reporting rules including Scope 3:
“Newly proposed rule by the US Securities and Exchange Commission on March 21, 2022 requiring SEC-registered domestic and foreign companies to disclose climate-related information in registration and periodic reports.”
“The proposed disclosures are similar to those that many companies already provide based on broadly accepted disclosure frameworks, such as the Task Force on Climate-Related Financial Disclosures and the Greenhouse Gas Protocol.”
“Scope 3: Indirect emissions from upstream and downstream activities in a registrant’s value chain (Scope 3), if material, or if the registrant has set a GHG emissions target or goal that includes Scope 3 emissions, in absolute terms, not including offsets, and in terms of intensity.”
CBAM and Scope 3
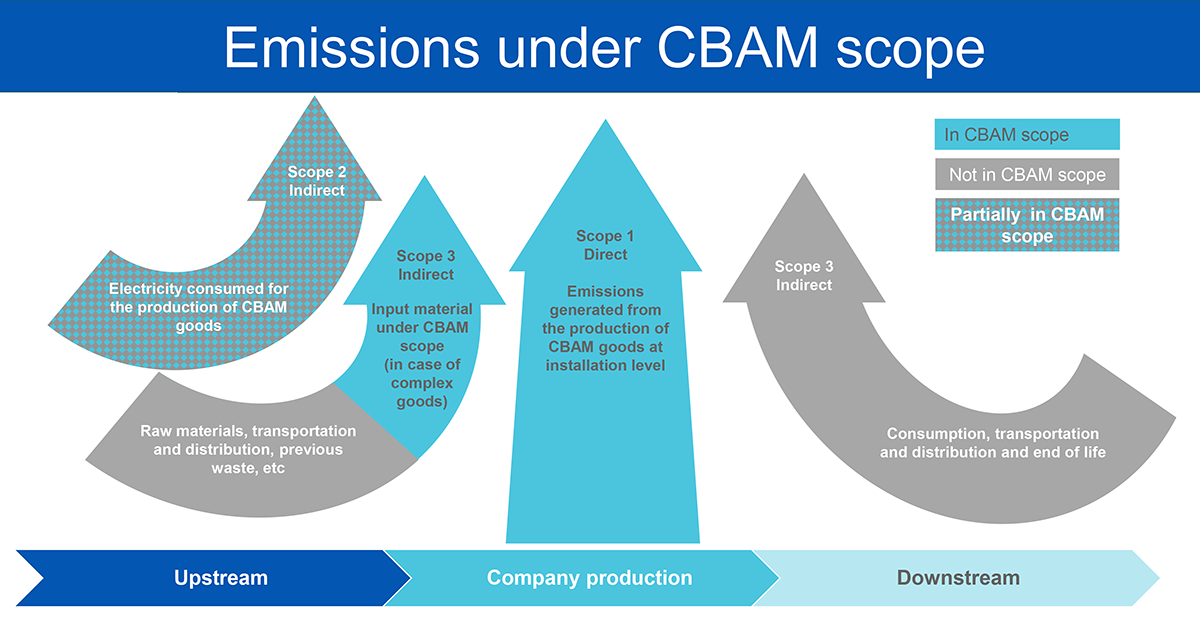
Legislated as part of the European Green Deal, the Carbon Border Adjustment Mechanism (CBAM) is a tariff that puts a price on a range of carbon-intensive products imported by members of the European Union (EU). CBAM takes into account both direct and indirect emissions (including Scope 1, Scope 2 and some Scope 3). Whether an organisation manufactures in the EU or is a non-EU-based supplier to these organisations, CBAM compliance requirements apply to in-scope products from October 2023, ahead of the full rollout in 2026. Initial industries covered by EU CBAM are electricity, hydrogen, cement, fertilisers, aluminum and iron & steel. More industrial sectors will be added by 2030 including oil refining, upstream (fuel production), all metals, pulp & paper, glass & ceramics, acids & organic chemicals, aviation, maritime and lime.
Related in-depth guide: Update 2024: How the Carbon Border Adjustment Mechanism (CBAM) impacts heavy industry
The EU Implementing Regulations13 (summary table below) outline what emissions – direct or indirect – and what GHG gases are to be reported on by product. Initially, only indirect emissions are required to be reported for electricity, cement, and fertilisers. However, the CBAM regulation states that ‘as soon as possible’ indirect emissions, therefore some components of Scope 3 will be required to be reported across all products.
| Goods/ Product | Emissions Type | GHG |
|---|---|---|
| Cement | Direct and Indirect Emissions | Carbon dioxide |
| Electricity | Direct and Indirect Emissions | Carbon dioxide |
| Fertilisers | Direct and Indirect Emissions | Carbon dioxide and nitrous oxide |
| Iron and Steel | Direct emissions | Carbon dioxide |
| Aluminium | Direct emissions | Carbon dioxide and perfluorocarbons |
| Hydrogen | Direct emissions | Carbon dioxide |
Source: EU Commission Presentation14
The EU Implementing Regulations9, emissions considered to be Scope 3 from the GHG Protocol for some ‘complex’ goods do need to be included in the calculation of embedded emissions for CBAM. Complex goods are those that use input materials called precursors, and fuels that contain embedded emissions.
The ‘Emission under CBAM scope’ diagram above outlines the component of Scope 3 that is included in the CBAM scope, being a portion of upstream emissions.
How does Scope 3 impact mining and resources?
As the world strives to achieve net-zero emissions by 2050, large-emitting sectors like mining and resources are under enormous pressure to track, analyse and reduce their footprints. As a major contributor to emissions, Scope 3 emissions are a core piece of the sustainability puzzle.
The full impact of new reporting rules and the global market shift towards sustainability on specific businesses and industries remains to be seen. However, here we look at a range of sectors and how they are impacted differently when it comes to Scope 3 emissions.
Scope 3 and the mining industry
A high-profile target and slow starter, miners and metal processors of all kinds face intensifying pressure to decarbonise in areas such as operational efficiency, electrification and renewables to meet compliance, control costs, and maintain their reputation and social licence to operate.
While Scope 3 emissions are included in upstream production, such as energy use, the majority come from downstream processes like smelting, refining, manufacturing and transportation of raw materials. As a significant proportion of mining’s total, and therefore global, emissions, tracking and minimising Scope 3 emissions is mine operators’ top priority sustainability challenge.
Mitigating these emissions necessitates collaboration with downstream entities to develop lower-emission processing technologies and engaging with customers committed to lower-emission technology.
Scope 3 and the chemicals industry
Contributing raw materials to a vast array of products from primary chemicals to plastics and fertiliser, the chemical sector is one of the highest energy consumers and CO2 emitters. It accounts for a major proportion of Scope 3 emissions across the supply chain lifecycle, upstream and downstream, from sourcing materials, transportation and energy consumption during manufacturing to the environmental impact of product use and eventual disposal.
Emissions minimisation levers include optimising manufacturing processes, finding cleaner energy sources, enhancing transportation efficiency, and implementing strategies for product reuse, recycling, or responsible disposal.
Scope 3 and the building materials industry
Fuelled by rising industrialisation and urbanisation, the construction industry – including cement, aggregates, glass, plastics, insulation, bricks and more – is striving to meet growing demand with fewer emissions. Builders, consumers and governments are pushing hard to go green and create a circular economy.
A critical area of concern lies within the upstream Scope 3 emissions, predominantly stemming from the use of raw materials like aluminium, cement, clay, copper, glass, gypsum, steel and timber. These emissions are generated both during the manufacture and use of building products.
To tackle this challenge, there’s a growing need for collaborative, long-term partnerships with suppliers. There’s an opportunity for significant impact by reassessing product specifications such as thickness, weight, renewability and recyclability of components. This can require collaboration of developers, designers, engineers and contractors to balance sustainability with functionality.
Scope 3 and the oil and gas industry
Power generation from fossil fuels is the world’s largest source of CO2. The sustainability and net zero movements are accelerating the electrification of everything from transport to heavy industry. The resulting surge in demand for power heightens the need to embrace renewable sources such as solar and wind.
While Scope 1 and Scope 2 emissions directly relate to extraction and production processes, Scope 3 emissions account for a substantial proportion of the total carbon emissions of the oil and gas industry. These include indirect emissions downstream such as end-users’ electricity consumption.
Effectively managing and reducing Scope 3 emissions will be pivotal for these companies to navigate the evolving reporting regulations, meet investor expectations, maintain profits and contribute meaningfully to global efforts aimed at mitigating climate change.
Scope 3 and the automotive industry
Given its extensive supply chain and broad environmental footprint, Scope 3 emissions reporting significantly impacts the automotive industry. While Scope 1 and 2 emissions primarily relate to manufacturing and direct energy usage, Scope 3 emissions encompass the entire lifecycle of vehicles, from the extraction and processing of raw materials such as metals and plastics, manufacturing processes across the supply chain and vehicle use, to the eventual disposal or recycling. Particularly noteworthy are emissions attributed to the use phase, where vehicle fuel consumption and tailpipe emissions significantly contribute to Scope 3 totals.
Reducing Scope 3 emissions requires collaboration across the supply chain to source suppliers of sustainable materials, streamlining manufacturing, producing more efficient vehicles and maximising end-of-life recycling. Manufacturers are also increasingly investing in electric and hybrid technologies to curb emissions during the use phase and meet driver demand for sustainable vehicles.
What are the methods for calculating Scope 3 emissions data?
The first challenge of Scope 3 reporting is to determine how to best collect this data from within the organisation and from third parties.
An important first step is to define why it is important to understand Scope 3. Is it simply to tick the compliance box or meet the reporting expectations of external stakeholders? Or is it also to reduce emissions to hit sustainability targets, cut costs or position the business as a green supplier?
More general methods based on averages and assumptions can tick the box, while achieving bigger strategic objectives will be enabled by using process and product specific data.
How do you select Scope 3 calculation methods?
There are multiple calculations for most Scope 3 categories which range in their levels of specific detail. More specific methods will yield higher quality data, but typically require more time resources. Companies should select the method that meets their needs based on the following criteria as detailed in the GHG Protocol Technical Guidance for Calculating Scope 3 Emissions15:
- The relative size of the emissions from the scope 3 activity
- The company’s business goals (see chapter 2 of the Scope 3 Standard)
- Data availability
- Data quality
- The cost and effort required to apply each method
- Other criteria identified by the company.
Companies should select calculation methods that ensure that the inventory appropriately reflects the GHG emissions of the activities and serves the decision-making needs of users, both internal and external to the company.
Note that each scope 3 category may contain multiple activities (for example air travel and road travel could be two different activities within category 6, Business travel). If appropriate, different calculation methods can be used to calculate emissions from different activities within a category.
There are several ways to go about calculating Scope GHG emissions (using the GHGP Scope 3 Standard). Here we outline common methods:
Spend data
A very common method for calculating Scope 3 emissions is based on procurement spending and estimating carbon emissions based on average or standard calculations. While this is a relatively simple method, it lacks accuracy and completeness, can rely on outdated data, and is only measured at an enterprise or facility level, rather than at a product or process level. This method doesn’t help demonstrate reduced emissions other than spending less.
The GHG Protocol (under category 1 of Purchased Goods and Services) describes this method:
Estimates emissions for goods and services by collecting data on the economic value of goods and services purchased and multiplying it by relevant secondary (e.g., industry average) emission factors (e.g., average emissions per monetary value of goods).
These emissions factors are typically based on industry benchmarks, published databases and government statistics. It is inaccurate due to reliance on estimates and average emissions factors.
Supplier surveys
Another popular method to assess and manage indirect emissions is to ask suppliers to share their primary emissions data. While this encourages transparency and collaboration its challenges include needing all suppliers to cooperate, complex management, inconsistent data quality and the need for ongoing verification. Not all suppliers will be able to provide accurate GHG data and it does not scale easily across hundreds or thousands of suppliers.
The GHG Protocol (under category 1 of Purchased Goods and Services) outlines this method:
Collects product-level cradle-to-gate GHG inventory data from goods or services suppliers. Once this data has been gathered across the entire supply chain, the relevant emissions factors can be applied to calculate scope 3.
Average data
Another method is using average data to make estimates around total emissions, instead of using financial spend data, this method uses metrics such as the mass of goods purchased, and relies on secondary data and industry averages.
The GHG Protocol (under category 1 of Purchased Goods and Services) outlines this method:
Estimates emissions for goods and services by collecting data on the mass (e.g., kilograms or pounds), or other relevant units of goods or services purchased and multiplying by the relevant secondary (e.g., industry average) emission factors (e.g., average emissions per unit of good or service).
Hybrid data
A combination of methods, this method uses both supplier-specific data and activity-based data, and attempts to fill the gaps with industry averages.
The GHG Protocol (under category 1 of Purchased Goods and Services) outlines this method: Uses a combination of supplier-specific activity data (where available) and secondary data to fill the gaps. This method involves:
- Collecting allocated scope 1 and scope 2 emission data directly from suppliers;
- Calculating upstream emissions of goods and services from suppliers’ activity data on the amount of materials, fuel, electricity, used, distance transported, and waste generated from the production of goods and services and applying appropriate emission factors; and
- Using secondary data to calculate upstream emissions wherever supplier-specific data is not available.
This method relies more on primary data so it may yield accurate results, assuming this primary data is available.
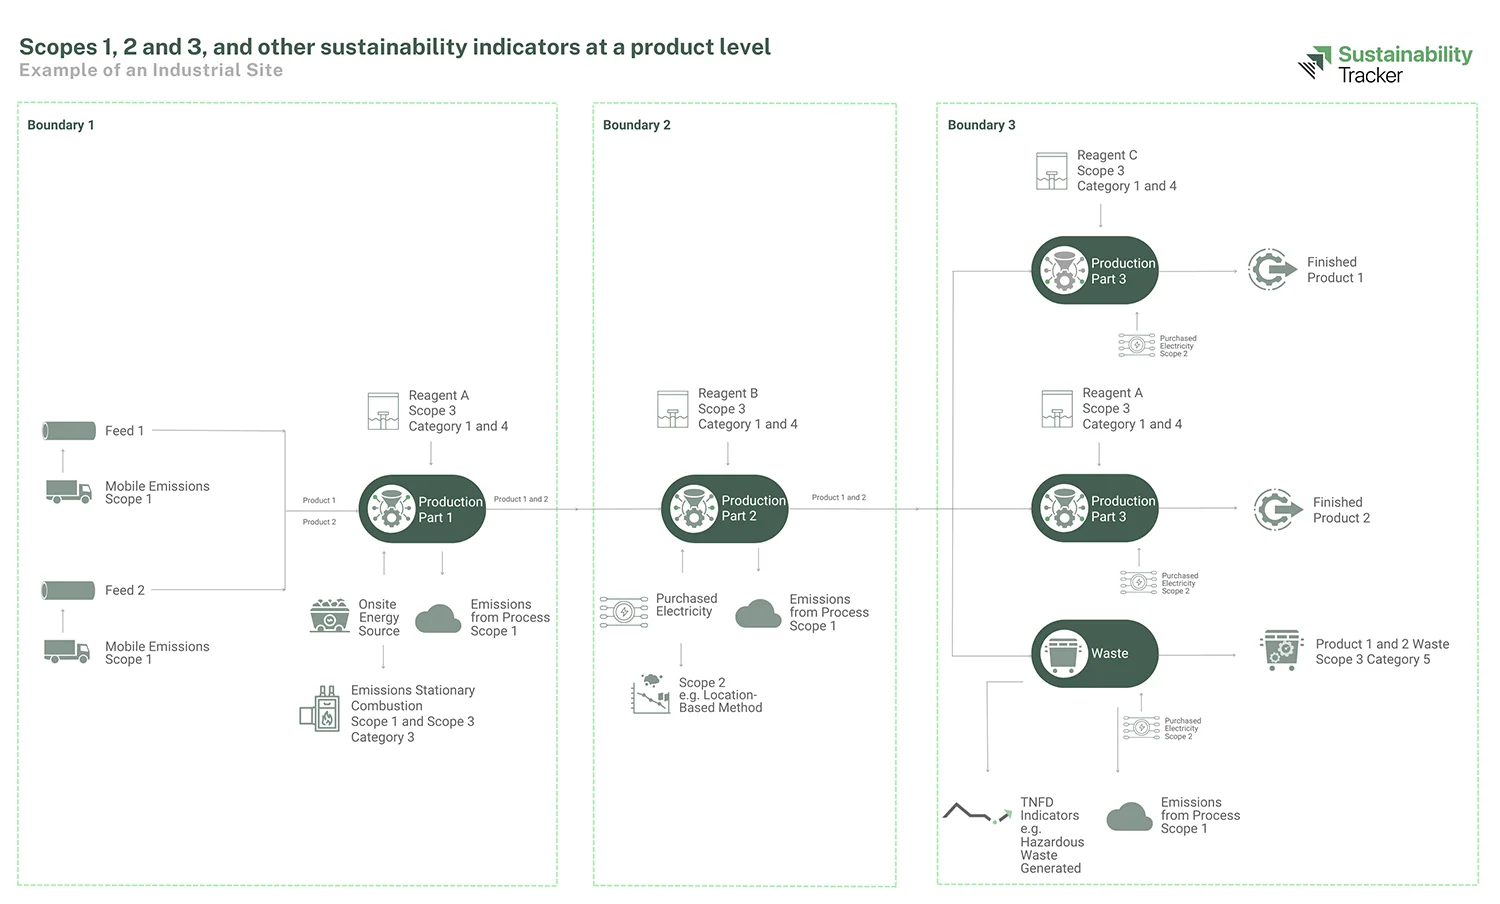
What are the methods used to calculate sustainability metrics at a product level?
Increasing requirement for Scope 3 product-level reporting
The methods described above for calculating Scope 3 emissions are calculated at the corporate level, not a product level. However, legislators are moving towards requiring reporting at a product level.
Depending on local jurisdictions, new reporting rules will require qualitative metrics and granular quantitative reports on a wide range of sustainability indicators not only across the entire operation and supply chain, but increasingly down to a product level in many cases.
Regulations will require some industries to calculate total carbon emissions embedded in a product (quarterly reporting) and imposes an import tax based on the PCF of the imported goods.
Average data will be replaced over time as supplier-specific data becomes available as legislation matures. This is a significant challenge for mining and resources operations with numerous sources of Scope 1, 2 and 3 emissions across multiple products.
Jurisdictions around the world are expected to increase their requirements for product-level carbon reporting. For example, in the US the draft Clean Competition Act (CCA) includes 25 sectors that impose a tariff on the difference between product actual emissions and the US baseline emissions.
GHG Protocol and Scope 3 emissions at a product level
A collaboration of the World Resources Institute (WRI) and the World Business Council for Sustainable Development (WBCSD), the Greenhouse Gas Protocol (GHG Protocol) provides the foundation for globally accepted emissions accounting and reporting standards for business.
There are three primary GHG Protocol standards that together deliver a comprehensive approach to emissions measurement, reporting and management across the value chain – the GHG Protocol Scope 3 Standard(2011)16, Product Standard(2011)17, and Corporate Standard(2004)6.
As detailed by the GHG Protocol: The Scope 3 Standard and Product Standard both take a value chain or life cycle approach to GHG accounting and were developed simultaneously. Scope 3 Standard builds on the GHG Protocol Corporate Standard and accounts for value chain emissions at the corporate level, while the Product Standard accounts for life cycle emissions at the individual product level.
- The Scope 3 Standard enables a company to identify the greatest GHG reduction opportunities across the entire corporate value chain. This standard helps a company identify GHG reduction opportunities, track performance, and engage suppliers at a corporate level.
- The Product Standard enables a company to target individual products with the greatest potential for reductions.
When it comes to selecting which standard(s) to follow, industrial organisations should select whichever most closely align with their reporting requirements and business objectives.
The figure below provides a simple example of the relationship between the three standards for a company that manufactures one product (Product A). It demonstrates how scopes of emissions at the corporate level correspond to life cycle stages at the product level.
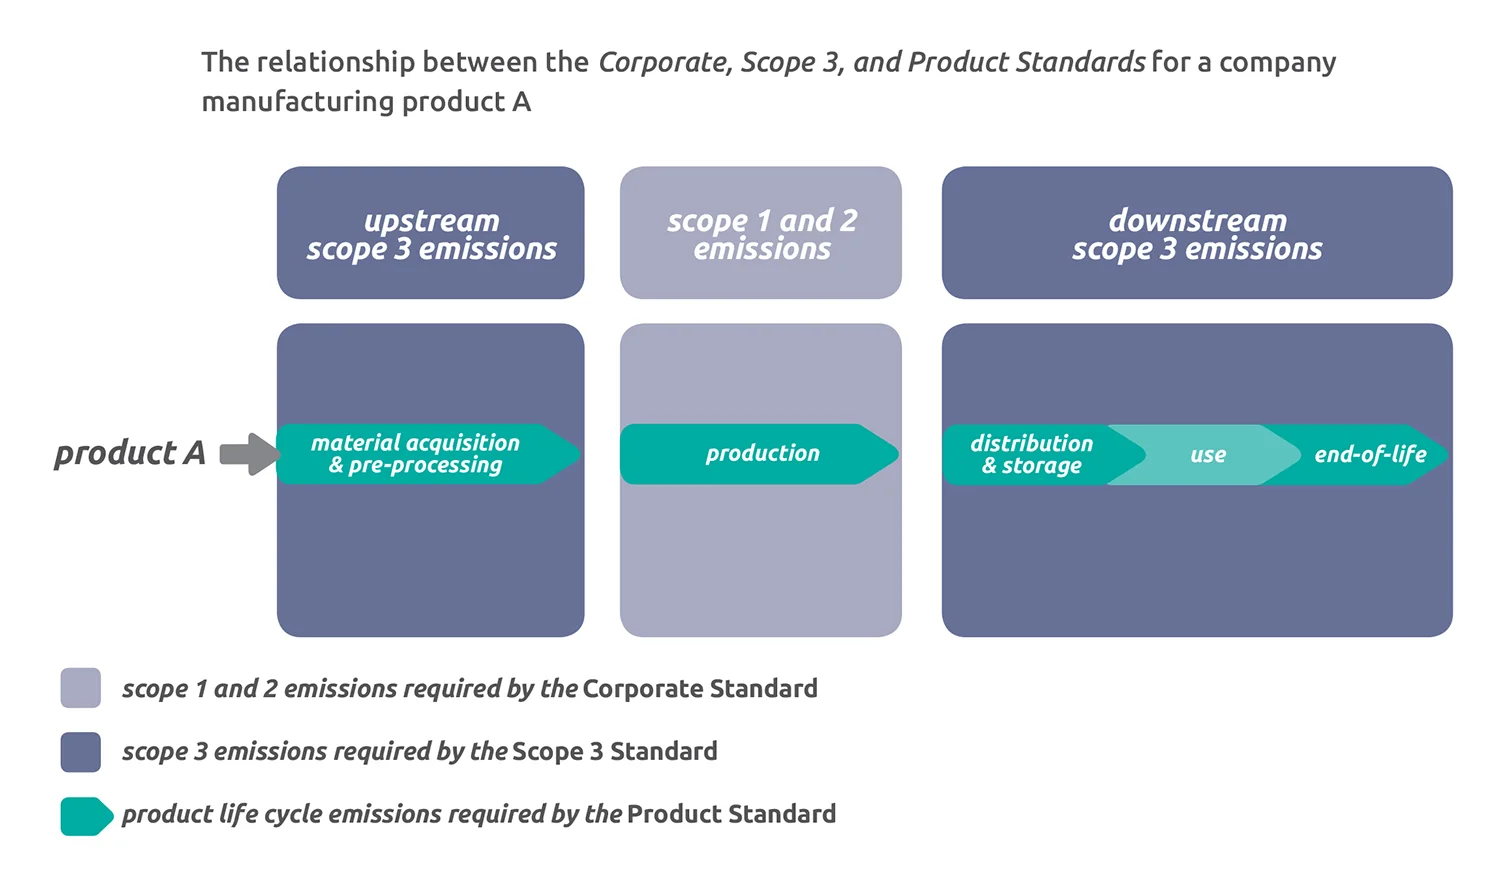
Figure source: PGHG Protocol Product Standard18
In the following section, we describe accurate methods used to calculate sustainability, climate and nature indicators/metrics at a product level.
Product Lifecycle Assessment (LCA), or 'cradle-to-grave'
What is a LCA?
With a growing demand for more precise data, LCA is becoming more common as a comprehensive and scientifically accurate method to assess a product’s lifecycle emissions from raw material extraction and manufacturing to transportation, use and disposal. LCA considers environmental indicators beyond just carbon emissions, including factors such as water use, energy consumption, resource depletion and various types of pollution. Providing a holistic view, it helps identify areas for improvement.
A LCA study is comprised in two phases. The first is Life Cycle Inventory (LCI). This quantifies material and energy inputs and outputs across all lifecycle stages according to the environmental impact categories that form the scope of the LCA. For the impact category of climate change, one of the inputs includes energy consumed, and an output would be GHG emissions. For other nature impact categories, inputs include materials used such as fertiliser and output is nitrogen compounds. The second phase is the Life Cycle Impact Assessment (LCIA) that weighs and standardises the outputs into common units for each environmental impact category.
What is cradle-to-grave?
The LCA is also called cradle-to-grave, which simply means it includes all lifecycle stages of a product’s complete environmental footprint from start (manufacture) to end (disposal).
What is cradle-to-cradle?
A slight variation to an LCA (cradle-to-grave), cradle-to-cradle goes one step further and rather than ending at disposal, it replaces that with the process of recycling/upcycling where the materials are reused for another product, so it becomes a circular process.How does Scope 3 and LCA differ?
The Scope 3 Standard divides the Scope 3 categories that reside upstream or downstream. These concepts are similar to an LCA. However, the intention of an LCA is not to measure upstream and downstream emissions, but to evaluate the environmental impacts of a specific product or process.
Scope 3 accounting is a narrow application of LCA. Scope 3 tracks only GHG emissions output and includes no assessment of weighting of environmental impact categories. When measuring Scope 3, information gathered in the first phase of the LCA, the LCI, the activity data that is used in the LCI would be the activity data used in the Scope 3 calculation. Multiplying activity data by emissions factors is one of the commonalities between an LCA and Scope 3 GHG accounting.
With the TNFD forming guidance on sustainability frameworks and nature impact metrics now being included in these frameworks, it is important to measure GHG as well as nature indicators at a product level. LCA data is becoming increasingly required to meet the measurement requirements of new sustainability standards and frameworks.
Product Carbon Footprinting (PCF)
What is a PCF?
PCF is a specific subset of LCA that focuses exclusively on quantifying the carbon emissions generated at each stage of a product or service over its lifecycle from production to disposal. PCF is based on average data from production, purchased raw materials and purchased energy. It is particularly useful for assessing and reducing the specific carbon emissions associated with a product, which is crucial for addressing climate change.
There are various ISO standards that have been developed to calculate a PCF. These include (not limited to):
- ISO 14067 Standard19 – published in 2018, by The International Standards Organisation, builds on ISO standards for LCA , considered to be the international reference standard for calculating a PCF. It specifies principles, requirements and guidelines for the quantification and reporting of the carbon footprint of a product, consistent with International Standards on LCA, ISO 14040 and ISO 14044) This standard is considered to be a more general standard where the two standards below provide more detail with less space for interpretation.
- PAS 205020, one of the first carbon footprint standards developed, first published in 2008 and revised in 2011 and developed by the British Standards Institute (BSI)
GHG Protocol Product Standard18 – this was developed to be consistent with PAS 2050, however also including requirements for public reporting. Importantly, PAS 2050 and the GHGP Product Standards provide a consistent approach to the use and development of sector specific rules, known as product rules in the Product Standards and supplementary requirements in the PAS 2050 standard. This approach recognises the importance for sector/product specific rules in aiding consistent application of the standards within sectors.
How does Scope 3 and PCF differ?
Scopes 1, 2 and 3 are typically calculated at a corporate level of greenhouse gas emissions, where PCFs are carbon emissions at a product level. However, many of the Scope 3 categories do correlate to data that is to be captured in a PCF, such as purchased goods and services, transportation and distribution, use of sold products and product end of life treatment.What is the difference between a LCA and PCF?
A PCF only focuses on a single impact category, Global Warming Potential (GWP). A full LCA will account for additional impact categories such as water consumption, acidification, ozone depletion, and resource depletion.Product-level reporting requires data-driven tools
Relying on general data from procurement spends, supplier surveys and assumptions, averaged data and using spreadsheets and manual reporting will not meet the strict global compliance requirements. Only digital data collection and analysis tools will enable the delivery of the traceable and auditable reports required by regulators and stakeholders.
For example, a unique feature of Metallurgical System’s Sustainability Software Solutions is that they enable mining and minerals organisations to calculate their carbon footprint right down to a product level. Using Product Lifecycle Assessment (LCA) and Product Carbon Footprinting (PCF) methods, the solution calculates emissions by quantifying the energy, materials and waste in an industrial process as well as transport costs and much more.
This provides a complete data set of cradle-to-gate and cradle-to-grave impacts, from extraction of raw materials through to processing, production and distribution. Using comprehensive in-built calculations, customised reports can be delivered from an enterprise-wide view down to defined geographic locations, specific sites, boundary, category and product level.
Not only does this adhere to compliance frameworks, but it also means producers can offer their customers comprehensive and precise Scope 3 data for their own calculations which is a strong selling proposition in the new era of sustainability accountability.
How to calculate Scope 3 emissions in mining and resources
With reporting obligations already in place for many markets and regulations tightening, now is the time to start preparing and deploying data capture and reporting capabilities to capture, analyse and report on Scope 3 emissions.
While many operations have basic reporting systems and data on their direct emissions, many have little or no visibility into the carbon footprints of the factories, suppliers and partners across their supply chains (Scope 3) due to their current dependence on siloed legacy systems and manual processes to achieve this.
When preparing to calculate Scope 3 emissions for the mining and resources sector, it is important to look at the end-to-end product lifecycle and consider it from the perspective of a supplier as well as a customer. For example, Scope 1 and 2 emissions for a supplier become Scope 3 emissions for a buyer, so it is important to measure Scope 1, 2 and 3 emissions in parallel.
When calculating Scope 1 consumption of an input material for a production facility, this same measurement is applied when calculating Scope 3 for that purchased input material. Customers will ask their suppliers for the embedded emissions in their purchased products when reporting on Scope 3.
Producing this level of granular detail needed to transparently and accurately report on Scope 3 emissions upstream and downstream, and comply with global guidelines, is not possible with manual data entry and spreadsheets. Today’s regulations require the use of digital sustainability reporting software to enable digitisation of processes and automate measurement.
9 steps for calculating Scope 3 emissions for a complex industrial asset
Based on a decade of experience, Metallurgical Systems has developed a comprehensive data-driven method for calculating Scope 1, 2 and 3 carbon emissions across mining and resources assets and the entire value chain, as well as measuring and reporting on other sustainability indicators for climate and nature.
While each operation is unique, these nine steps will equip mining, minerals and resources operations with access to the data and reports needed to meet evolving regulations and frameworks:
- Step 1: Understand reporting requirements
- Step 2: Assess existing technology and data
- Step 3: Automate asset-wide data processes
- Step 4: Simulate processes digitally
- Step 5: Categorise and tag data sets
- Step 6: Calculate activity data process-wide
- Step 7: Assign emissions factors and calculate CO2 equivalents
- Step 8: Generate sustainability reports
- Step 9: Set targets to reduce emissions
Step 1: Understand reporting requirements
Review relevant frameworks and metrics to be reported
Research which global frameworks and regulations apply to the organisation, map the mandatory or voluntary sustainability indicators that need to be measured, and identify all the data that are required across the value chain.
Step 2: Assess existing technology and data
Audit digital tools, data sources and automation
It’s critical to understand where the organisation is at with data collection and automation at each stage of business operations, production processes and supply chain (upstream and downstream). Determine what data is being collected, available and missing, and what digital systems and instrumentation is needed to measure activity data, consumption, movements in inventory and emissions and other sustainability metrics across the entire value chain.
Step 3: Automate asset-wide data processes
Centralise, validate, organise and automate data using machine learning
The next step is to centralise and digitise asset data from multiple sources across the operation into a single source of truth. This data needs to be fully traceable (so issues or anomalies can be identified and assessed). Interoperability is a key priority, which means information needs to be comparable from separate sources such as instruments or laboratories or different departments like mining, manufacturing, maintenance or environmental. Information should also incorporate budget, cost and forecast data, as well as other financial information, and be able to report directly to enterprise reporting systems. When this process is fully automated, it removes the need for slow and error-prone manual entry and consolidation of data.
Having centralised asset-wide data, it is possible to validate and organise data, ideally using machine learning to analyse huge volumes of data. This is typically required at three points throughout the data collection and calculation processes, to ensure data quality:
- Extraction and load stage: Validate source data to determine if there are missing values or samples, and that the values are within an expected range.
- Pre-processing stage: Prior to conducting a mass and energy balance of the industrial process (discussed in step 4), the digital solution should check measured data marked as critical to spot any instability in the values. Data should also be constantly validated and cross-checked during the mass balancing process to ensure the measured result from instrumentation, and other measured data sources, aligns with the calculated result from the simulation (simulation is discussed in Step 4), at that part of the process.
- Post-processing: Check calculated values from the digital simulation against the measured values from instrumentation, and other measured data sources, and flag major deviations for resolution or as an improvement opportunity.
Step 4: Simulate processes digitally
Use source data to run an end-to-end dynamic mass and energy balance
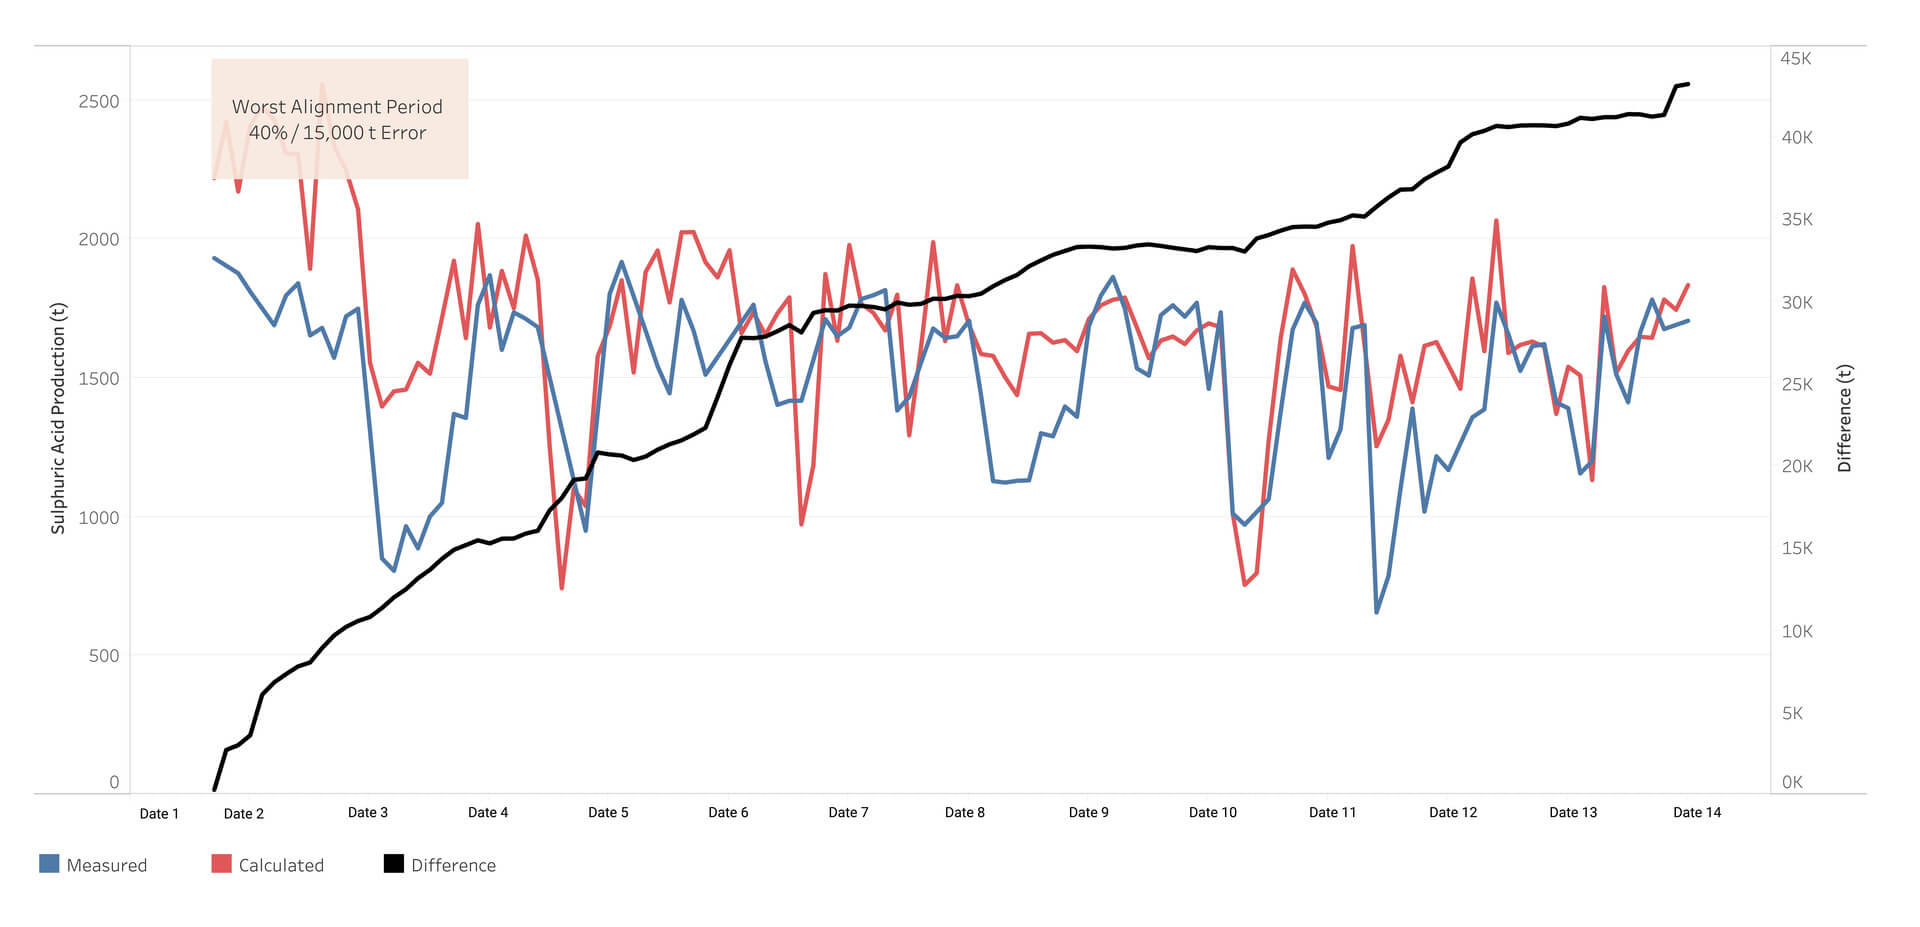
Using validated source data as inputs, perform a mass and energy balance of the entire production process using dynamic simulation. This can measure inventory using time as a dimension, track intermediate streams, and cross-check measured data with simulated calculated data for context and accuracy. There are no user assumptions made to deliver the mass and energy balance. This mass balance delivers contextualised data across the production process and supply chain to calculate and validate the granular activity data required for sustainability reporting.
For example, Metallurgical Systems MI Core® software uses dynamic simulation to perform an asset-wide mass and energy balance to reconcile the delivery, consumption, inventory and production activity data. The result is verified sustainability metrics that are fully traceable, immutable and unalterable, and surpass any rigorous audit tests for complete assurance.
Step 5: Categorise and tag data sets
Tag data types, boundaries, emissions categories and other sustainability metrics
Within the digital platform each validated data stream should be assigned a scope, boundary, category/ and data type to derive the most accurate activity data throughout the production process. Boundaries may vary between corporate offices and industrial sites, and the reporter will need the flexibility to alternate the calculations of the sustainability metrics according to each boundary.
Step 6: Calculate activity data process-wide
Track detailed data across the production process by individual product
Calculate activity data across the production process for each country, site, site boundary, scope, reporting category (such as fuels, reagents, waste, energy and water) and data type by individual product. Examples of activity data that is derived from validated measured data and calculated data at a product level includes:
- Quantity of fuel used
- Kilowatt hours of electricity used
- Production output
- Distance travelled
- Input consumption
- Waste produced to landfill and waste composition
- Water and consumption
- Volume of gases emitted and gas composition
Step 7: Assign emissions factors and calculate CO2 equivalents
Allocate emissions factors across the asset and value chain
Once the required activity data has been calculated, the next step is to assign the appropriate emissions factors. Metallurgical Systems’ Sustainability Software Solutions can connect to internationally recognised third-party databases such as the US EPA, eGRID, DEFRA, and country electricity factors from the IEA to use their emissions factors when calculating sustainability indicators for supplier-specific and custom emissions factors.
Step 8: Generate sustainability reports
Report on emissions and other sustainability and nature related indicators
With access to accurate, granular and traceable data, near real-time reports can be generated to meet the demands of evolving global standards and rules. ST is designed to be compliant with, and easily adapt to, diverse regulations and governance frameworks and requirements across different sites and countries as well as immediately capturing changes in sustainability indicators caused by any variations in the production process across the supply chain.
This includes tracking climate and nature related disclosures in line with requirements of:
- International Sustainability Standards Board (ISSB)
- EU Corporate Sustainability Reporting Directive (CSRD)
- Securities and Exchange Commission (SEC)
- Global Reporting Initiative (GRI)
- Sustainability Accounting Standards Board (SASB)
- Taskforce on Nature-related Financial Disclosures (TNFD)
… just to name a few.
On top of providing configurable data visualisation and analytics, the right digital tools give authorised personnel access to the data they need to make informed decisions and automates the reporting function to give staff time to focus on more valuable work.
Step 9: Set and meet targets to reduce emissions
Create, measure and report on reduction progress, including scenario analysis
Ticking today’s compliance box is just the start. To equip your organisation for long-term compliance, reduce costs and make a meaningful impact on emissions, current and emerging frameworks require tangible and verifiable action, including:
- Transition plans that can be independently verified and quantified using robust metrics detailing targets, offsets and mitigation strategies.
- Climate and nature resilience assessments that include future state scenario analysis – such as 1.5-degree Celsius increase in global warming set out in the Climate Change Act 2022 – and what these scenarios mean in terms of the financial and nature impacts to the business operations.
- The CSRD and the published standards (ESRS) are leading the way for nature-related metrics, reporting and targets where many companies will be required to disclose biodiversity and ecosystem-related topics such as pollution, water and marine resources, resource use and circular economy.
Setting decarbonisation goals and tracking progress toward those goals requires two essential ingredients: finance-grade sustainability data and a robust, auditable GHG emissions accounting process.
Mining case study: Enabling Scope 3 reporting at a granular level
Challenge:
With a global shift towards decarbonisation and tightening new reporting standards, truly understanding sources of Scope 3 emissions is more imperative than ever. Despite accounting for the majority of our client’s carbon footprint at their mining facility (Scopes 1 and 2), their Scope 3 emissions were poorly understood.
They engaged the team to deploy digital solutions to help them accurately capture the granular data they needed and analyse it to reduce emissions and streamline reporting.
The key to understanding and lowering Scope 3 emissions is a detailed breakdown of the different components by category. However, accessing a wide range of plant and business data and formulating it into a single report that updates regularly is often difficult.
Solution:
Using our Sustainability Software Solutions, we connected numerous data sources, including plant instrument historians, production databases and laboratory management systems. The data sources were consolidated and validated, into a single centralised location and fed into a process digital twin dynamic model.
This allows for the reconciliation of key measurements enabling accurate emissions to be calculated (including Scope 1, 2 and 3). The output is an accurate, validated and auditable representation of plant data that is accessible in a reporting database. Through this system, all scopes of carbon emissions, including Scope 3, can be reported easily, with results automatically produced daily for distribution and analysis.
Results:
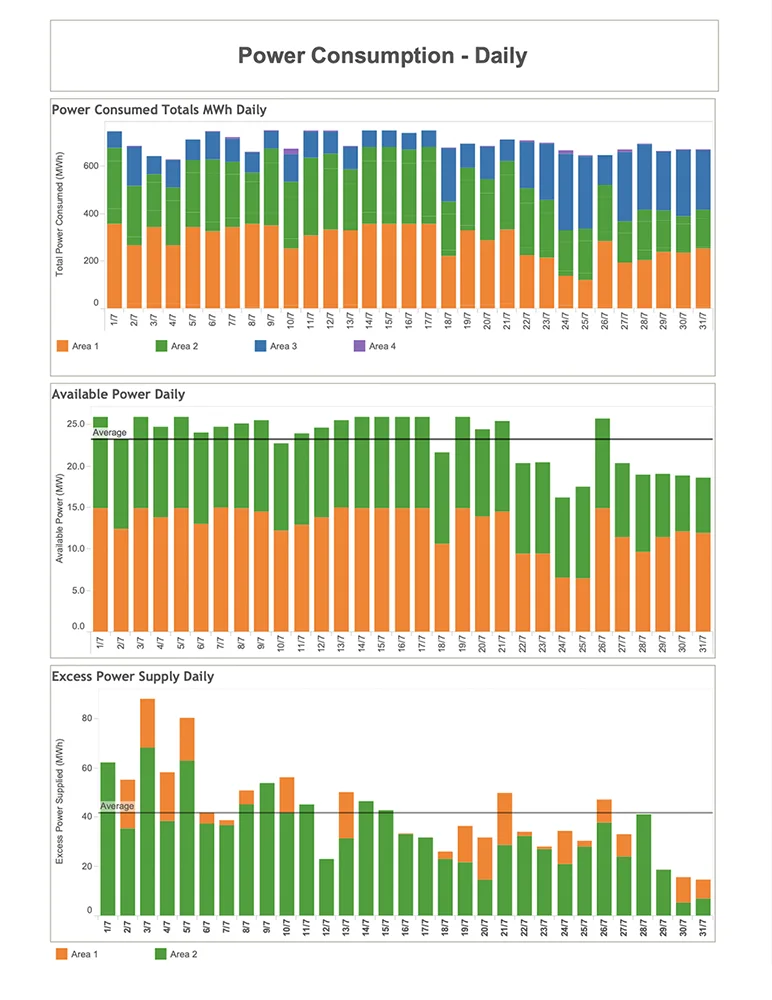
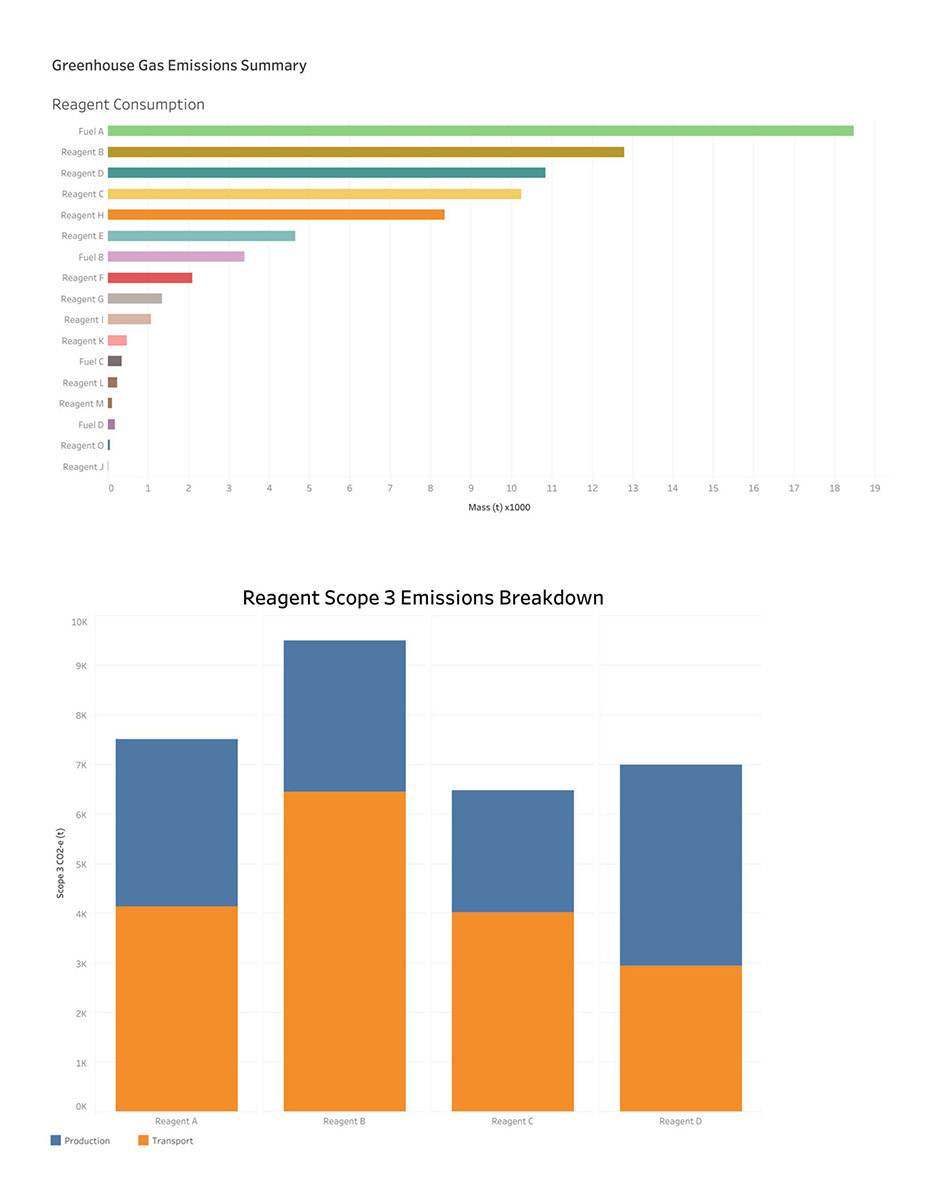
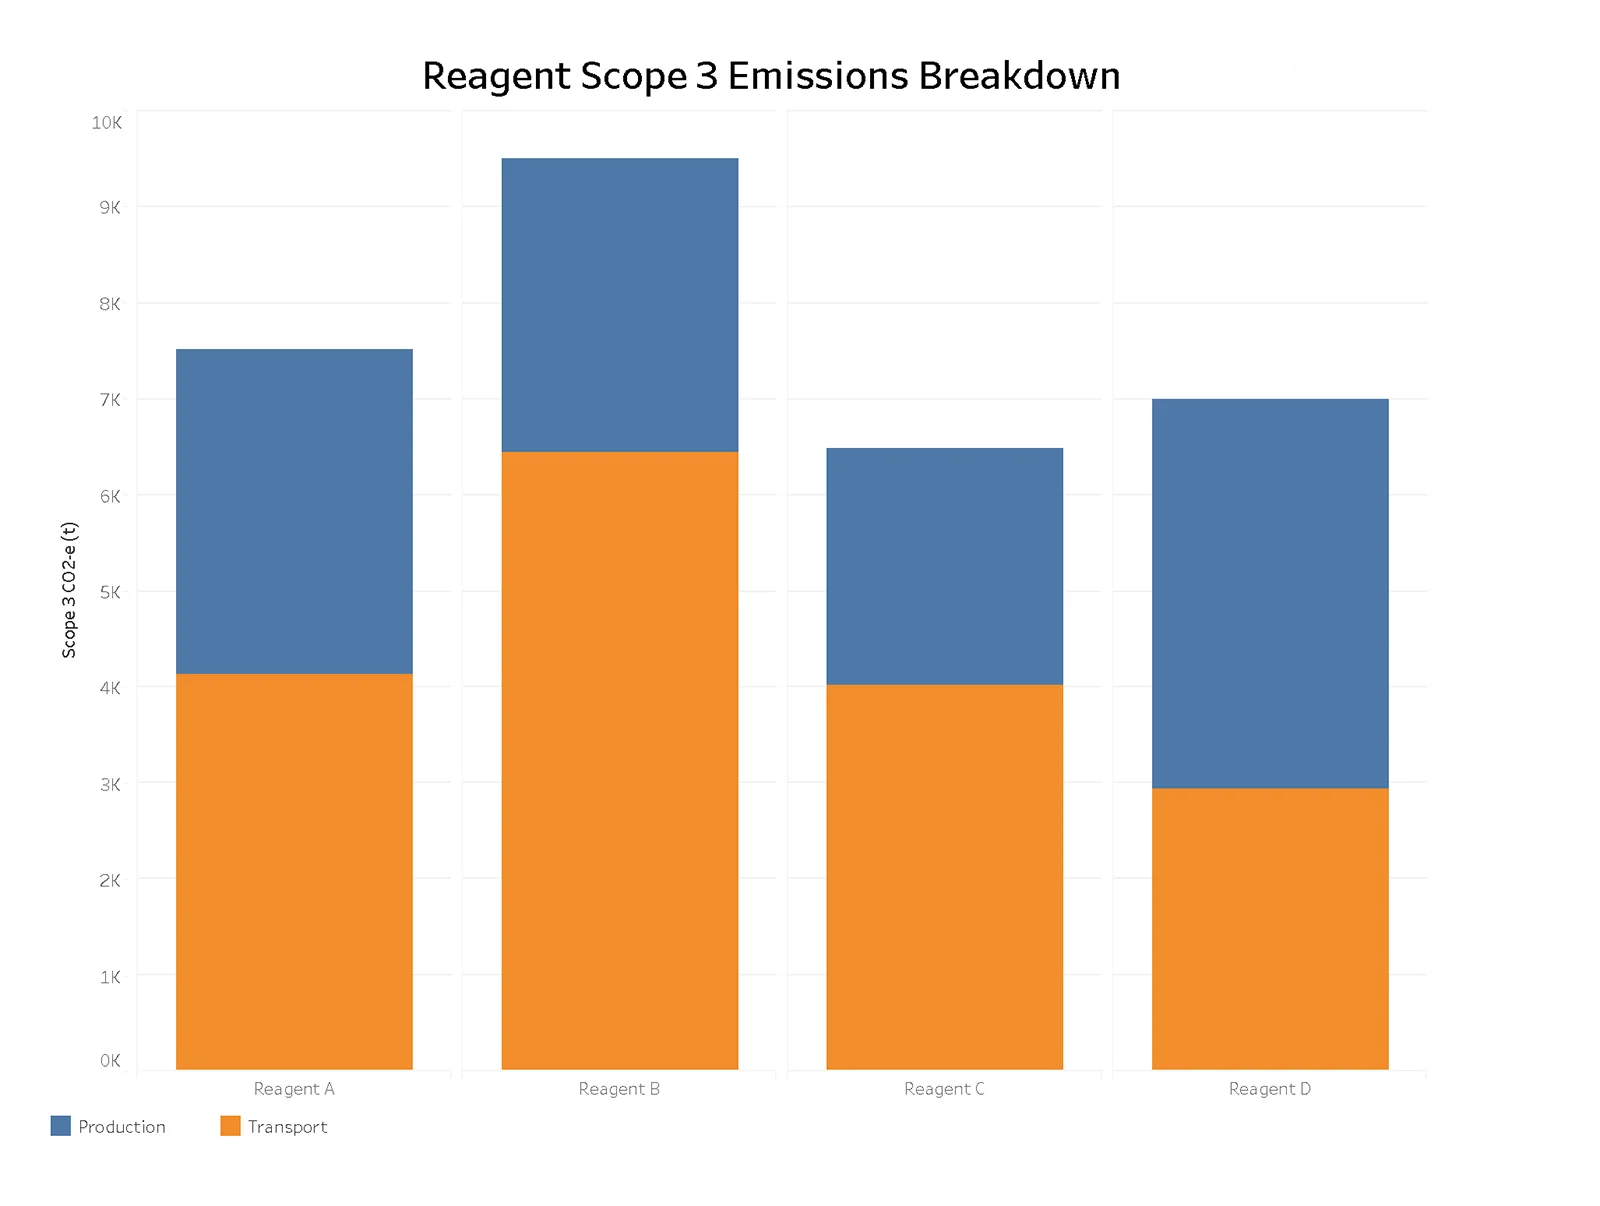
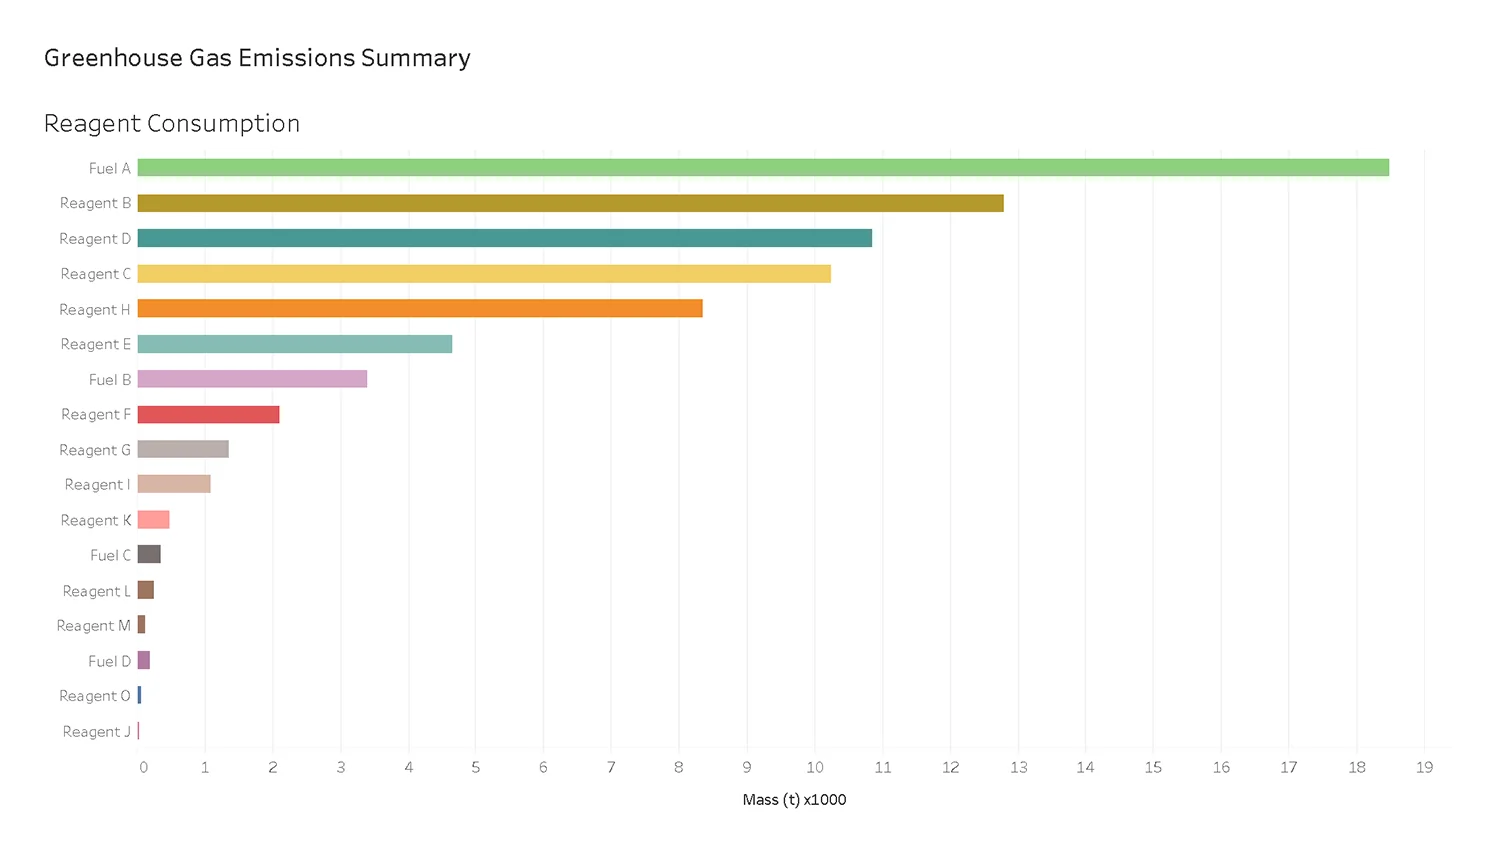
Using MI Core® software, detailed breakdowns of Scope 3 carbon emissions can be calculated and formulated. For example, sites can compare reagent consumption and calculate their impact on overall Scope 3 emissions.
This includes an overall contribution and also accounts for emissions related to individual factors such as extraction/production emissions and transportation. This caters for identifying key contributors to Scope 3 emissions and allows for an analysis and comparison of alternative options that may have different factors affecting their contribution (as shown in the graphs).
Scope 3 reporting demands transparency, completeness and collaboration
Most large mining, minerals and resources organisations will have reporting systems and data on their direct emissions to meet today’s basic reporting requirements. However, many have little or no visibility into the carbon footprints of the factories, suppliers and partners across their supply chains (Scope 3) – locally and globally – as they are relying on siloed legacy systems and manual processes to try and achieve this.
The latest detailed and data-intensive Scope 3 reporting requirements will necessitate extensive information sharing and collaboration across supply chains, which will require sophisticated digital measurement, analysis and reporting systems.
Producing the granular reports needed to transparently and accurately report on sustainability indicators including GHG emissions, water, energy, air quality, waste hazardous materials and nature-related risk factors, and to satisfy evolving guidelines is not possible without digital sustainability reporting software.
When looking at lowering emissions across the supply chain organisations cannot meet their compliance requirements and emission reduction targets on their own. It will require new levels of collaboration, cooperation and technological innovation between suppliers, partners and even competitors.
Analysis from a global consultancy suggests that addressing Scope 3 emissions across many energy-intensive industries has the potential to generate whole new operating models and business value.
“Lower emissions can lead organisations to radically transform business strategies by rethinking commercial models, making portfolio moves, and building partnerships across the value chain, as well as sourcing new low-carbon inputs and changes to product specifications to reduce emissions during the use stage.” 19
Operations that try to go it alone in the new era of sustainability risk being left behind.
The Scope 3 challenge: A lack of digital data, measurement and analytics tools
Having partnered with mining and resources organisations for over a decade, the team at Metallurgical Systems has seen that many operations don’t have the right digital tools and technology in place to support effective, efficient and detailed GHG emissions, water and energy consumption accounting – particularly when it comes to Scope 3.
For organisations that can’t measure and report transparently on their operations at a granular level, there is no baseline from which to accurately report on current emissions to demonstrate compliance or calculate reductions.
Today’s largely manual and disconnected processes are not working. In fact, a global Carbon Measurement Survey of executives across nine major industries found that while 96% have set targets to reduce emissions in at least one area, only 11% have managed to cut emissions in the last 5 years, 81% omit some internal scope emissions (Scope 1 & 2), and 66% do not report any external emissions (Scope 3).
While some organisations are making great progress, others are still relying on the same legacy systems and processes they have been using for many years. For these organisations, accurate emissions reporting is going to become increasingly challenging.
Without the right data-driven sustainability platform, it’s impossible to meet Scope 3 and other reporting requirements, let alone implement effective decarbonisation strategies.
To become more sustainable – and meet increasingly strict sustainability compliance obligations including Scope 3 – mining and resources operations are on the look-out for better ways to not just measure and report on greenhouse gas emissions, energy and water consumption, but reduce consumption, too.
Opportunities to lead the way
The rapid shift towards sustainability and a new era of legislated accountability present significant challenges for mining and resources, particularly around Scope 3 data. However, for organisations willing to embrace the change and move fast there are significant growth opportunities.
While Scopes 1 and 2 emissions are the most controllable and simplest to measure, estimates show that Scope 3 accounts for an average of 75% of an organisation’s carbon emissions (CDP). So, anyone serious about decarbonisation needs to tackle Scope 3 measurement, reporting and reduction both within their operation and in collaboration with their supply chain partners.
Successfully taking control of Scope 3 emissions can deliver a range of benefits:
Position the business as a sustainability leader
The ability to effectively track, optimise and report on tangible reductions in emissions, power consumption and water usage delivers a significant competitive advantage as global markets increasingly favour sustainable operations.
Unlock new opportunities as a green supplier
Tightening regulations make transparent, compliant and sustainable suppliers more attractive to buyers under pressure to transition. Promote the fact that Scope 3 data is available to clients for their reporting to make it simpler and more affordable to be their partner.
Meet compliance and sustainability goals
The right tools will enable the setting of measurable and sustainable targets, transparently report on performance over time, prove that effective compliance systems are in place and contribute to achieving net zero by 2050.
Reduce operation costs and inefficiencies
Replacing manual, siloed and non-auditable reporting tools such as spreadsheets with digital tools enables organisations to collect, centralise and synchronise the data needed to automate sustainability reporting, streamline processes, reduce emissions and save money.
If there are gaps in an organisation’s in-house digital platforms or analytics expertise, engaging a specialist consultant to assist with advice on technology, data, compliance or reporting early in the process can accelerate the process.
Scope 3 reporting is only achievable with effective digital software
Introducing Metallurgical Intelligence® (MI)
Metallurgical Intelligence® (MI) is a sophisticated technology platform that captures, centralises and consolidates huge amounts of disparate data into a digital twin of your operation’s processing operations.
MI’s core functionality powers metallurgical accounting, process optimisation and production reporting. On top of this, it has in-built world-leading capabilities around auditable reporting for direct and indirect GHG emissions, energy and water consumption and other climate and nature related sustainability indicators.
Having been proven over a decade in mining and minerals – and readily customisable across diverse industries – MI is the world’s only established sustainability reporting solution to quickly and accurately calculate, validate and report according to new regulations.
Already implemented in plants across 9 countries globally – and translated into English, Spanish, French and Russian – MI is an enterprise-wide data software platform that captures, centralises, consolidates and validates huge amounts of data across multiple sources, across the end-to-end mining value chain into a digital twin replica of a plant’s processing operations.
It provides unique and unprecedented transparency with the ability to forecast and deliver near real-time auditable reports for emissions and energy use across Scope 1, 2, and 3. It also covers the increasingly important area of water consumption and other climate and nature-related metrics to keep you a step ahead of critical sustainability measures and fast-changing policies.
To learn how Metallurgical Intelligence® can help create transparent, consistent and complete sustainability reports that comply with Scope 3 reporting rules and other emerging and evolving frameworks, contact our expert team on +61 2 7229 5646 or info@metallurgicalsystems.com
About Metallurgical Systems
Founded in 2010, Metallurgical Systems is a world-leading technology company that achieves operational excellence for minerals processing plants.
Based in Sydney, Australia, our solutions are deployed across the globe – in 9 countries, 4 continents and in 4 different languages – and are supported by a highly experienced team of metallurgists, chemical engineers and technical experts.
Metallurgical Systems has invested over 400,000 hours of product development over the course of 10 years to build our market-leading solutions, and the advanced calculations they are capable of are unparalleled. We continue to invest in research and development to ensure they remain at the forefront of the industry.
Highly customisable to suit the unique needs of every plant, Metallurgical Systems’ award-winning solutions are available as CAPEX or OPEX investments and can be deployed 100% remotely.
About the authors
This article has been collaboratively authored by the team at Metallurgical Systems, and fact-checked and authorised by Managing Director and industry specialist John Vagenas.
References
- BCG, Carbon Measurement Report Survey 2021
- Carbon Disclosure Project (CDP), Technical Note: Relevance of Scope 3 Categories by Sector, 2023
- ESG Today, Research reported in More than a Third of Public Companies Now Reporting Scope 3 Emissions, 2023
- The Net Zero Tracker, Net Zero Stocktake 2022
- KPMG, Big shifts, small steps – Survey of Sustainability Reporting 2022
- GHG Protocol, Corporate Standard
- ISSB, IFRS2 Sustainability Disclosure Standard, 2023
- GHG Protocol, Statement: New Standard from the ISSB Requires Disclosure of Scope 3 Emissions, 2023
- EUR-Lex, The European Council, 2022
- European Commission, Corporate sustainability reporting, 2023
- EFRAG, Update on Set 2 content and planning of sector standards, 2022
- SEC, Factsheet: Enhancement and Standardization of Climate-Related Disclosures
- EUR-Lex – Access to European Law, EU regulations, 2023
- EU Commission, Carbon Border Adjustment Mechanism Presentation, March 2023
- GHG Protocol, Technical Guidance for Calculating Scope 3 Emissions, 2013
- GHG Protocol, Scope 3 Standard
- GHG Protocol, Product Standard
- Figure source: PGHG Protocol Product Standard
- ISO, ISO 14067:2018 Standard Carbon footprint of products, 2018
- GHG Protocol, PAS 2050