A technical White Paper for the Australian Resources Sector
Depending on local jurisdictions, new reporting rules will require granular qualitative and quantitative metrics and reports on a wide range of sustainability indicators, across the entire operation and supply chain, increasingly down to a product level.
This paper distils the requirements for the Australian resources sector, however Metallurgical Systems has extensive experience providing sustainability consulting and solutions for those in other jurisdictions.
Contact our expert team on email or by phone at +61 2 7229 5646 to discuss your business.
Abstract of themes covered in this White Paper
Globally and in Australia, legislators, shareholders, investors, employees and market sentiment have aligned to demand sustainability reporting transparency, particularly for energy-intensive industries like the minerals and resources sector.
Driven by the International Sustainability Standards Board (ISSB), leading European Union (EU) bodies, the U.S. Securities and Exchange Commission (SEC), and the Safeguard Mechanism in Australia, new standards will require disclosures on sustainability indicators such as greenhouse gas emissions across Scopes 1, 2 and 3, water, energy, air quality, waste, hazardous materials, pollutants, nature-related risk factors, Product Carbon Footprint (PCF), Life Cycle Assessment (LCA) and TNFD impacts.
The need for periodic reporting in a machine-readable digital taxonomy, scenario analysis and forward-looking statements means that data-driven technology is the only solution to meet evolving compliance standards. Manual spreadsheets simply cannot capture or process the volumes of data needed to deliver immutable, unalterable and auditable sustainability reports.
This technical white paper explains how to leverage machine learning technology to centralise asset-wide industrial data, dynamically simulate an organisation’s operations as a process digital twin, perform an asset-wide mass and energy balance, and deliver granular, finance-grade reports across sustainability indicators. It also explains how metallurgical accounting, production accounting and sustainability reporting go hand in hand for the mining and minerals industry.
Sustainability reporting is rapidly elevating to be on equal footing with financial reporting in terms of accountability and priority. Australian Securities and Investments Commission (ASIC) is already cracking down on greenwashing in their May 2023 report with substantial civil penalties, shareholder activists demanding action by boards, and share prices and capital markets hinging on ESG credit ratings.
Now is the time to act, with only a short runway to prepare before new regulations take effect.
Contents
- Abstract
- Introduction
- What are the new sustainability reporting rules for the Australian resources sector?
- The Safeguard Mechanism and National Greenhouse and Energy Reporting (NGER)
- Biodiversity, Ecosystems and the Taskforce on Nature-related Financial Disclosures (TNFD)
- How can digital tools overcome the data challenge?
- Why are digital reporting tools the only way to meet evolving regulations?
- Deploy machine-readable digital taxonomy from day one
- Enable automation, data quality and auditability
- Track scopes 1, 2 and 3 emissions and industry-specific disclosures
- Data-driven forward-looking statements using scenario analysis
- Transition planning and climate-related targets
- Nature-related disclosures
- Product Carbon Footprinting (PCF)
- Conclusions
- References
Introduction
As the world strives towards net zero, energy-intensive industries are under increasing pressure to accurately measure, report on and reduce their impact.
For the first time in Australia and across the world, legislators, shareholders, investors, employees and market sentiment have aligned to demand sustainability reporting transparency, particularly for energy-intensive industries. Businesses, consumers, staff, partners and governments are responding to this by switching to more sustainable products and services.
This new environment directly impacts the role and decisions of boards, company directors, executives, governance and risk management professionals, metallurgists, operations managers and all senior professionals in the minerals and resources sector.
To assist with an appropriate response, this paper explains
- the immediate frameworks impacting the Australian resources sector;
- key sustainability indicators to measure, track and disclose;
- the crucial link between metallurgical accounting, process optimisation, and sustainability reporting; and
- how modern digital tools enable organisations to make these disclosures accurately and at a reasonable level of assurance.
What are the new sustainability reporting rules for the Australian resources sector?
As the Australian Government responds in line with international guidelines and regulations, a strict new era of legislated sustainability reporting and accountability will apply from 2024.
Here, we look at the primary international standards, starting with Australia’s Commonwealth Treasury consultation paper, which is our industry’s most pressing sustainability reporting change.
Commonwealth Treasury Consultation Paper
The recent Commonwealth Treasury Consultation Paper on Climate Reporting proposes to adopt International Sustainability Standards Board (ISSB) standards in the 2024/2025 financial year. Large Australian companies and financial institutions will face mandatory climate-related reporting requiring limited assurance at first, with the view to broaden the scope over three years to include smaller organisations, building to a required reasonable level of assurance. Well beyond qualitative metrics, this would require granular quantitative metrics and reporting on sustainability and climate-specific indicators including greenhouse gas emissions across all scopes, climate resilience scenario analysis, climate targets and forward looking statements to a level of detail not found in current Australian reporting practices.
The International Sustainability Standards Board (ISSB)
On 26 June 2023, The ISSB issued two international standards for investor-focused sustainability reporting. IFRS S1 – being General Requirements for the Disclosure of Sustainability-related Financial Information, and IFRS S2 – covering climate related disclosures. Their intention is to create a global baseline for sustainability-related financial disclosures. Both standards are based on the four pillars used in the Task Force on Climate-Related Financial Disclosures (TCFD) framework; governance, strategy, risk management and sustainability-related metrics and targets – referred to in the standards as the ‘core content’. The two standards are designed to disclose decision-useful information to capital markets and securities regulators and require information about all material sustainability-related and climate-related risks and opportunities that could reasonably affect the cash flow of an entity, access to finance and the cost of capital.
What is declared as material aligns with the International Accounting Standards Board (IASB) definition stating:
It is now for jurisdictions to decide if and how they will incorporate these standards into national law or for companies to adopt the ISSB standards voluntarily.
TABLE 1 – Summary of the IFRS Foundation Standard – IFRS S1 and IFRS S2
| IFRS Standards -reporting across four ‘core content’ areas; governance, strategy, risk management and metrics and targets | |
Background On 26 June 2023, the ISSB released its first two International Sustainability Disclosure Standards (IFRS SDS or the Standards) that become effective 1 January 2024. These two standards are:
These standards report across four ‘core content areas’: Governance, Strategy, Risk Management, and Metrics and Targets. These two standards are designed to be applied together and alongside future industry-specific standards. In time, a full suite of topic-specific IFRS Sustainability Disclosure Standards will be released, including disclosures around human capital, biodiversity and other nature-related risk factors. Currently, efforts are being made to establish a universal standard for ensuring sustainability-related disclosures, with ongoing work by the International Accounting and Assurance Standards Board to create ISSA 5000 as the worldwide benchmark for providing assurance on sustainability disclosures. Although there is a high demand for a single global standard, the United States and the European Union are separately developing climate reporting systems. The ISSB has collaborated with officials from the US, Europe, Japan, and China, as well as the International Organisation of Securities Commissions (IOSCO), which includes 35 securities regulators from over 140 jurisdictions, to establish compatibility. However, there may still be some gaps. IOSCO announced on 25th July 2023 its endorsement of the ISSB standards following its comprehensive review and rapid adoption is expected in a number of jurisdictions. |
|
IFRS S1: General Sustainability Disclosures (overarching principles) Reference: IFRS Foundation (IFRS S1) |
IFRS S2: Climate Related Disclosures Themed/topic specific disclosures – Climate related Reference: IFRS Foundation (IFRS S2) |
Objective of IFRS S1 Entity needs to understand the resources it relies on and relationships along its value chain – resources and relationships are a source of value for the entity. A reporting entity’s first step to determine what information to include in its sustainability report is an analysis to identify sustainability-related risks and opportunities. The second step is to consider which sustainability-related risks and opportunities are material to disclose and information that faithfully represents a sustainability-related risk or opportunity that would be relevant to the decision making needs of the entity’s primary users. An entity shall refer to and consider the applicability of the metrics included within the disclosure topics of the SASB standards. The definition of material is as per IFRS definition of materiality, meaning if omitting, misstating, or obscuring that information could reasonably be expected to influence decisions that the primary users (existing and potential investors, creditors and lenders) make based on that information. |
Objective of IFRS S2 The entity is required to reveal details regarding its exposure to major climate-related risks and opportunities. This will enable users of general purpose financial reports (GPFR) to evaluate how these risks and opportunities affect the entity’s financial position, performance, and cash flows, as well as its enterprise value, strategy, and business model. An entity must also consider the applicability of the industry-based disclosures outlined in the “Industry-Based Guidance on Implementing IFRS S2”, which is based on the climate-related disclosures in the SASB standards. |
Overview It is required for entities to disclose all significant information regarding sustainability-related risks and opportunities that come about from their reliance on resources and relationships. These may impact an organisation’s access to cash flow, finance, or cost of capital in the short or long term. Examples of such risks and opportunities include their employment practices and those of its suppliers, product packaging waste, potential supply chain disruptions, control over assets such as production facilities that rely on scarce resources, control over investments including those in associates and joint ventures, and sources of financing. Financial data and sustainability data need to be aligned: An entity must use the same financial data for its sustainability reporting as is used for financial reporting (to the extent that it is possible). For example, a resources company uses the number of units of a product it expects to produce when preparing a scenario analysis for a sustainability report. The same number of units of product should be used for financial reporting purposes. |
Overview IFRS S2 identifies two types of climate-related risk: Physical risks: the physical risks from climate change, e.g. direct damage to assets, indirect effects of supply-chain disruption, changes in water availability, sourcing and quality of resources, extreme temperature changes affecting physical assets/operations/supply chain/transportation and employee safety. Transition risks: risks associated with moving to a lower-carbon economy, e.g. policy, legal, technology, market and reputational risks that may carry financial implications for an entity, such as operating costs or asset impairment due to new climate-related regulations or by shifting customer demands and the development and deployment of new technology. The climate-related opportunities available to the entity are also in scope. |
Core Content Governance: Entity’s governance controls, processes and procedures. Strategy: Organisations need to consider the risks and opportunities around sustainability that may impact their future prospects. This includes detailing their potential financial impact on their business model and value chain, and assessing how these factors may affect their strategy, decision making, financial performance and cash flows. This should be taken into account in the entity’s financial planning. Additionally, this information should be disclosed to primary users to help them understand how resilient the entity’s strategy and business model is in terms of sustainability risks. Risk management processes: Organisations need to be clear on how they identify, measure and prioritise sustainability risks. This includes detailing elements such as the criteria used, data sources, scope of operations covered, scenario analysis, process changes from the previous year, and how the risks are evaluated in terms of their characteristics, magnitude and probability. Progress metrics and targets: Organisations need to ensure that primary users can understand their performance regarding sustainability-related risks and opportunities. To do this they need to disclose specific industry-based metrics that demonstrate progress towards regulated targets including, milestones, interim targets, and an analysis of trends or changes. |
Core Content Governance: Align with IFRS S1 focused on climate. Strategy:
Risk management: Align with IFRS S1 focused on climate. Progress metrics and targets: Disclosures on how an entity uses metrics and targets to measure, monitor and manage identified climate-related risks and opportunities. This includes cross-industry metrics, industry-based metrics, metrics and targets set by the entity and any targets required by law or regulation. Cross industry metrics – qualitative and quantitative:
Industry-based metrics: In determining the industry-based metrics that the entity discloses, the entity is to refer to the “Industry-based Guidance on Implementing IFRS S2”. For Metals and Mining, refer to the IFRS S2 Climate-related Disclosures Appendix B Industry-based disclosure requirements, Volume B10 – Metals & Mining. Targets: An entity is required to disclose quantitative and qualitative climate-related targets it has set. For each target, the entity is to disclose:
Other GHG emission targets disclosures:
|
These two standards are designed to be applied together and alongside future industry-specific standards. In time, a full suite of topic-specific IFRS Sustainability Disclosure Standards will be released, including disclosures around human capital, biodiversity and other nature-related risk factors.
Currently, efforts are being made to establish a universal standard for ensuring sustainability-related disclosures, with ongoing work by the International Accounting and Assurance Standards Board to create ISSA 5000 as the worldwide benchmark for providing assurance on sustainability disclosures.
Although there is a high demand for a single global standard, the United States and the European Union are separately developing climate reporting systems. The ISSB has collaborated with officials from the US, Europe, Japan, and China, as well as the International Organisation of Securities Commissions (IOSCO), which includes 35 securities regulators from over 140 jurisdictions, to establish compatibility. However, there may still be some gaps. IOSCO announced on 25th July 2023 its endorsement of the ISSB standards following its comprehensive review and rapid adoption is expected in a number of jurisdictions.
EU’s Corporate Sustainability Reporting Directive (CSRD)
The European Parliament and Council has gone even further than the ISSB. The European Council has legislated the CSRD from January 2023 and EU member states have until July 2023 to incorporate its provisions into national law. A number of member states have started to transpose the CSRD into national law. The CSRD requires companies to make extensive disclosures about sustainability performance and related strategic implications. Disclosures are prescribed by the European Sustainability Reporting Standards (ESRS). In July 2023 the European Commission published the final text of its first set of ESRSs. Disclosures for some companies will be required as early as the 2024 reporting period.
How does the CSRD affect Australian resources companies?
The scope provisions of the CSRD are broad and apply to many companies operating in the EU, estimated to be nearly 50,000 in total. To assess if an Australian resources company falls within the scope of the CSRD will be complex and needs to be considered according to the EU Member State national law once the state has incorporated the CSRD.
Generally speaking it will cover:
- Australian resources companies with securities listed on an EU-regulated market (with limited exceptions)
- Australian resources companies (listed or not) with annual EU revenues exceeding €150 million and an EU branch with net turnover of more than €40 million
- Australian resource companies with annual EU revenues exceeding €150 million and an EU subsidiary that is a large company, meeting two of the three criteria: more than 250 EU-based employees, a balance sheet above €20 million or a local revenue of more than €40 million.
Australian resources companies without direct reporting obligations under the CSRD may be asked for information by customers, suppliers, investors or lenders because of the requirements for other entities that fall within the scope of the CSRD and are required to disclose information about their value chain, or because they are subsidiaries of EU companies with reporting obligations.
TABLE 2 – What do in-scope Australian resource companies need to disclose?
Twelve standards These 12 standards report across four ‘core content areas’; Governance, Strategy, Risk Management, and Metrics and Targets. Reference: European sustainability reporting standards – first set | |
| Two ESRS cross-cutting standards | Ten ESRS topic-specific standards (subject to materiality assessments) |
ESRS 1: General requirements
ESRS 2: General disclosures
| Environmental
Social
Governance
|
For future release – Sector-specific ESRSs are yet to be drafted at the time of writing this paper.
The ESRSs are designed to support the EU Green Deal and to align with existing sustainability frameworks in the EU such as Sustainable Finance Disclosures Regulation (SFDR) and EU Taxonomy.
The Carbon Border Adjustment Mechanism (CBAM)
In April 2023, the CBAM was introduced as part of the European Green Deal, which means EU importers of goods covered in the scope of CBAM regulation will be required to submit quarterly reports of embedded emissions within these goods to the European commission.
From October 2023, EU-impacted organisations will be expected to comply with reporting requirements across Scopes 1, 2 and 3 of emissions reporting, in advance of the full European Union Carbon Border Adjustment Mechanism (CBAM) rollout in 2027.
CBAM goes further than reporting on an organisation’s direct emissions (Scope 1), requiring measurement, and reporting on indirect electricity and other indirect emissions (Scopes 2 and 3). With Scope 3 emissions a significant contributor to energy-intensive industries, it is critical that industrial organisations have the capability to accurately calculate their indirect emissions.
CBAM and the Australian resources sector
The Australian Government’s Safeguard Mechanism Reforms Position Paper in January 2023 stated that it is currently considering the option of implementing a system similar to the EU CBAM, which would allow them to levy tariffs on imported goods that are carbon-intensive such as the resource sector.
This was supported in August 2023 with Climate Change Minister Chris Bowen announcing that Australia could impose a carbon border adjustment mechanism, as reported in the Australian Financial Review.
An analysis by Refinitiv reported that non-EU businesses, like Australian resources companies, that operate in jurisdictions that have adopted ISSB, EU and SEC standards will need to be able to track, report and comply with these sustainability frameworks.
CBAM puts a price on carbon-intensive products entering the EU from October 2023, with other countries set to follow.
The Safeguard Mechanism and National Greenhouse and Energy Reporting (NGER)
The Australian Government’s Safeguard Mechanism has been in place since 1 July 2016, requiring Australia’s highest greenhouse gas emitting facilities to keep their emissions below a set baseline (business as usual levels, adjusted for production levels). If the facility exceeds the baseline, it must manage its excess emissions and may face a penalty if it fails to comply.
In March 2023 the Australian Government’s National Greenhouse and Energy Reporting (Safeguard Mechanism) Amendment (Reforms) Rules 2023 was passed by the Australian Parliament. These reforms take effect from 1 July 2023, and require Safeguard facilities to reduce their emissions in line with Australia’s climate targets.
Each covered facility is required to report its emissions annually to the Clean Energy Regulator. If a safeguard facility does not exceed its baseline for a financial year on or after a financial year commencing July 2023, it may receive Safeguard Mechanism credit units (SMCs). If they exceed their baseline for a financial year commencing July 2003 then they can:
- purchase Australia Carbon Credit Units (ACCU)
- surrender SMCs
- apply to borrow baseline from the following year (repaid with interest)
- apply to become a trade-exposed baseline-adjusted (TEBA) facility and receive a discounted decline rate (up to 3 years)
- apply for a multi-year monitoring period (MYMP) to allow more time to reduce emissions.
How is the baseline calculated?
A default decline rate of 4.9 percent p.a. applies to standard and landfill baselines (not sectorial/grid-connected electricity generation facilities). For resources companies, standard baselines will be calculated by multiplying the quantity of product that a Safeguard facility makes, by the defined emissions budget per unit of production, transitioning from facility-specific emissions intensity values to industry average values by the 2029 – 2030 financial year.
Who falls under the scope of the Safeguard Mechanism?
The Safeguard Mechanism applies to facilities that emit more than 100,000 tCO2-e of Scope 1 (direct emissions) in a financial year. There are presently 215 covered facilities accounting for approximately 30 percent of Australia’s greenhouse gas emissions.
The Safeguard Mechanism is administered through the National Greenhouse and Energy Reporting (NGER) Scheme. As well as keeping emissions below the baseline, Safeguard facilities must adhere to the reporting and record-keeping requirements of the NGER.
What information needs to be recorded as part of the NGER?
As outlined by Australia’s Clean Energy Regulator (CER), records of activities must be adequate to enable the CER to ascertain whether the corporation or the person has complied with its obligations under the NGER Act. This includes information that can be used to verify the relevance, completeness, consistency, transparency and accuracy of reported data during an external audit.
Reporters are encouraged to record both the decision-making process and the details of the calculation and data analysis methods used for greenhouse gas emissions and energy production and consumption. Recommended records include but are not limited to:
- a list of all sources monitored
- the activity data used for calculation of greenhouse gas emissions for each source, categorised by process and fuel or material type
- documentary evidence relating to calculations – for example, receipts, invoices and details of payment methods
- documentation of the methods used for greenhouse gas emissions and energy estimations
- documents justifying the selection of the monitoring methods chosen
- documentation of the collection process for activity data for a facility and its sources
- records supporting business decisions and accuracy, especially for high-risk areas relating to reporting coverage (for example, applying concepts of controlling corporation, corporate group and facility).
When facility-specific emissions factors are used, records should document the monitoring methods used and the results from the development of these emissions factors as well as information such as biomass fractions and oxidation or conversion factors.
The Greenhouse Gas Protocol describes other records that might be kept to maintain a high-quality and easily auditable greenhouse gas inventory.
Spotlight on Rio Tinto – Immediate impact of the safeguard reforms:
As reported in The Australian article of July 2023 Mining giant Rio Tinto books half-year net profit of $US5.1bn but aluminium assets slashed in value, Rio Tinto has slashed $US1.2bn from the value of its Australian aluminium assets on the back of the federal government’s safeguard mechanism. It wrote off the value of its Yarwun alumina refinery completely due to the need to buy carbon offsets for the asset, which demonstrates the immediate and significant impact of new rules rolling out.
Biodiversity, Ecosystems and the Taskforce on Nature-related Financial Disclosures (TNFD)
Companies are required to understand the implications of biodiversity loss for their business. That is risk and opportunities to economic activities and financial assets that depend on biodiversity. For example, variability to access of feedstock, exposure to extreme environmental conditions, and/or trade and regulatory constraints.
Internationally, recognition of financial and systematic materiality of biodiversity risks is represented by the Network for Greening the Financial System, the UN Principles for Responsible Investment, the TNFD, the World Economic Forum (WEF), the Organisation for Economic Co-operation and Development, governments and national banks.
Although not yet adopted in Australia, companies may need to disclose the risks and opportunities to the impact of the company on biodiversity, even if the risks or opportunities do not affect the company’s financials.
For the Australian resources sector, the type of ecosystems service that would need to be reported would be water supply, water flow regulation, solid waste remediation & soil quality regulation, global climate regulation, rainfall pattern regulation and storm mitigation.
The TNFD has developed guidance for organisations when assessing nature-related risks and opportunities using a ‘LEAP’ framework.
- locate the interface with nature
- evaluate dependencies and impacts
- assess risks and opportunities
- prepare to respond to nature-related risks and opportunities and report.
The TNFD framework is due to be published in September 2023. It is expected that the Australian Government will consider the IFRS S1 Sustainability reporting standard, including nature and biodiversity issues that could apply in Australia.
What do Australian resource companies need to measure now to comply?
The range of new regulations rolling out globally will require a level of accuracy, detail, transparency, auditability, timeliness, frequency, scenario analysis and forward-looking statements far beyond Australian reporting practices today – and above the current capabilities within many organisations.
Depending on local jurisdictions, the new rules will require qualitative metrics and granular quantitative disclosures on a wide range of sustainability indicators such as greenhouse gas emissions across Scopes 1, 2 and 3, water, energy, air quality, waste, hazardous materials, pollutants, nature-related risk factors, Product Carbon Footprint (PCF), Life Cycle Assessment (LCA) and Taskforce on Nature-related Financial Disclosures (TNFD) impacts. These indicators will need to be reported on across the entire operation and supply chain – increasingly down to a product level in many cases.
TABLE 3 – Summary of reporting requirements for Australian resources companies
While the full requirements will depend on location, sector and operation, this table summarises the most significant changes that Australian resources companies need to measure now to comply across international (ISSB, ESRS) and national (Safeguard Mechanism Reforms 2023) reporting frameworks:
| Proposed to be mandatory for first round of entities from 2024 – 2025 |
|
| Climate-related financial information |
|
| Risks and opportunities |
|
| GHG Emissions – Scope 1, 2 and 3 |
|
| Industry specific standards |
|
| Scenario analysis |
|
| Climate resilience |
|
| Transition planning and climate-related targets |
|
| NGER |
|
Not yet part of the reporting landscape in Australia, however important to start preparing for:
| TNFD & EU Impact disclosures/nature-related risks and opportunities | The EU Corporate Sustainability Reporting Directive (CSRD) and the ESRS are leading the way for nature-related disclosures. Subject to materiality, companies are required to disclose biodiversity and ecosystem-related topics such as ESRS E4 Biodiversity and Ecosystems, E2 Pollution, E3 Water and Marine Resources and E5 Resource Use and Circular Economy. The Australian treasury consultation paper highlights the need to implement a regulatory framework for reporting in other environmental impact areas such as nature and biodiversity. The ISSB looks to introduce more topic-specific standards that complement the Climate Standards with the recommendation of the Task Force on Nature-related Financial Disclosures (TNFD Recommendations). |
| Product carbon footprinting (PCF) | PCF is the sum of GHG emissions generated by a product over the various stages of its lifecycle. Cradle-to-gate and cradle-to-grave PCF. PCF is based on average data from production, purchased raw materials and purchased energy. Average data will be replaced over time as supplier-specific data becomes available as legislation matures. Product-specific guidelines for the calculations of PCFs in the industry for comparability of products. CBAM requires some industries, including the resources sector to calculate total carbon emissions embedded in a product (quarterly reporting) and imposes an import tax based on the PCF of the imported goods. Other jurisdictions are expected to follow. For example, in the US the draft Clean Competition Act (CCA) includes 25 sectors that impose a tariff on the difference between product actual emissions and the US baseline emissions. The Safeguard mechanism reforms also state that new products produced by an existing Safeguard facility and products produced by a new Safeguard facility will be subject to ‘best-practice’ emission intensity values. This means if a facility can measure the PCF of each product it produces accurately, the risk of overreporting embedded emissions is significantly reduced with an opportunity to exceed the industry average value and bank some Safeguard Credit units. |
| Digital Taxonomy | Digital financial reporting is mandatory in 14 of G20 nations, including the US, UK, France and Germany – but not in Australia. Australian companies have had the option to voluntarily lodge digital financial reports with ASIC since 2010. Under the Corporations Act, all companies must lodge PDF and/or paper financial reports through ASIC’s lodgement portal. A 2019 senate inquiry recommended the Australian Government make digital financial reporting standard practice in Australia. As reported by the AICD, the AASB is “strongly in favour” of building a digital taxonomy for financial reporting in Australia. The ISSB has been working on a digital taxonomy in tandem with the development of IFRS S1 and IFRS S2 to facilitate digital consumption of sustainability-related financial disclosures and aims to issue the final digital taxonomy in early 2024. Australia’s decision to make climate reporting mandatory is expected to lead to a surge in the use of digital corporate reporting, encompassing financial as well as climate and sustainability reporting. |
How can digital tools overcome the data challenge?
Metallurgical accounting and sustainability reporting go hand in hand for resources companies
At the heart of finance-grade sustainability reporting and metallurgical accounting is accurate, transparent and detailed activity data. Digital transformation for resources organisations provides the tools to accurately collect and track this information.
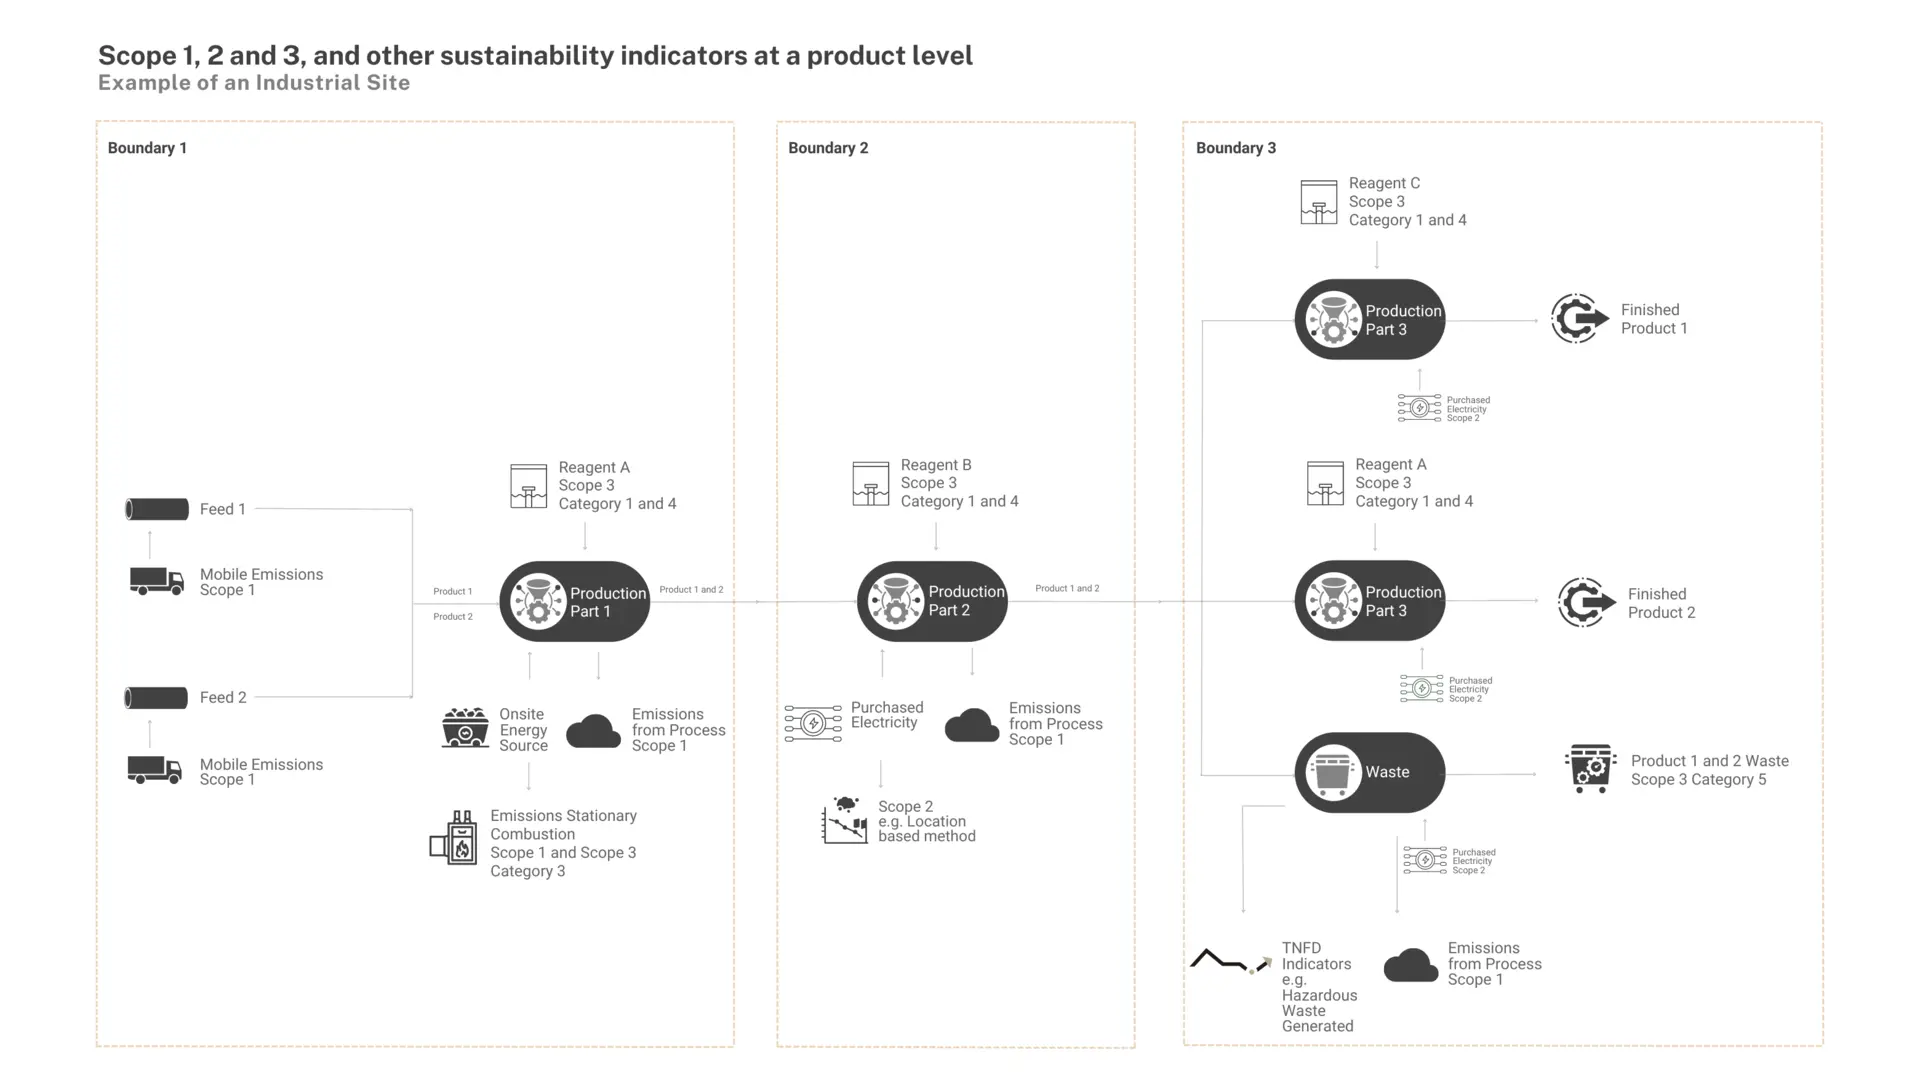
While data for sustainability reporting is typically collected from onsite metering or purchase records, best practice for resources facilities is to create a process digital twin of the operation and use source data to perform a granular plant-wide mass and energy balance, reconciled using dynamic simulation, that considers time dependency for batch processing.
Using a process digital twin, plant-wide data is collected, validated, simulated and analysed across the site, to give rich insights across the operation and supply chain so the facility can report on a broad range of sustainability indicators, including Scopes 1, 2 and 3.
It enables each validated data stream to be assigned a scope, site, boundary, category/source, and data type – down to a product level – to derive the most accurate and reliable activity data throughout the resources production process.
Emissions factors are applied using internationally recognised third-party databases and the digital twin solution maintains data tables for recognised emissions factors, supplier-specific and custom emissions factors.
Activity data is the key to accurate and auditable emissions accounting
Without integrated activity data connected to a dynamic simulation that is customised to the chemistry and process dynamics of a plant, tracking inventory – and therefore associated emissions, water and energy consumption – from start to finish is impossible.
Validated activity data streams that can be assigned a scope, boundary, category/source, and data type will derive the most accurate activity data throughout the industrial process.
Technical example A: What method delivers the most accurate activity data?
To calculate emissions of greenhouse gases, facilities often use the spend-based method as a consumption metric rather than an activity-based method. Whilst this may seem appropriate, it is not always the most accurate method of calculating emissions.
For example, the CO2 released from neutralising acid with limestone is often calculated from the limestone addition and embodied carbon within. This is often inaccurate, and leads to overreporting of Scope 1 emissions, as at a higher pH of 4-6, limestone will not be entirely consumed. This means CO2 emissions calculated through a spend-based method are higher than actual emissions.
The ideal solution to this problem is to use an activity-based method and a process digital twin, alongside the measurement of volume and acid concentration up and downstream of the dosage point. These direct measurements can be fed into the digital twin as inputs to accurately calculate the actual limestone consumption, and this consumption is reconciled against other plant information if instruments fail or lab analyses are inaccurate.
Using the activity-based method, a digital twin can accurately calculate CO2 emissions without overreporting. Limestone utilisation at a higher pH could lead to only 50 percent utilisation (effectively 50 percent error) as calculated by the digital twin model, and as a result, would lead to a decrease in reported Scope 1 emissions attributed to this process by the same value.
If an organisation can accurately measure their metallurgical accounting and production reporting, then its sustainability reporting uses this data to calculate sustainability indicators across the site (Scope 1), purchased energy (Scope 2) and supply chain/other indirect emissions (Scope 3).
Technical example B: Using activity data to accurately measure Scope 2 emissions
While purchased electrical power is commonly used to calculate Scope 2 emissions, using an activity-based method is more reliable for accurate reporting.
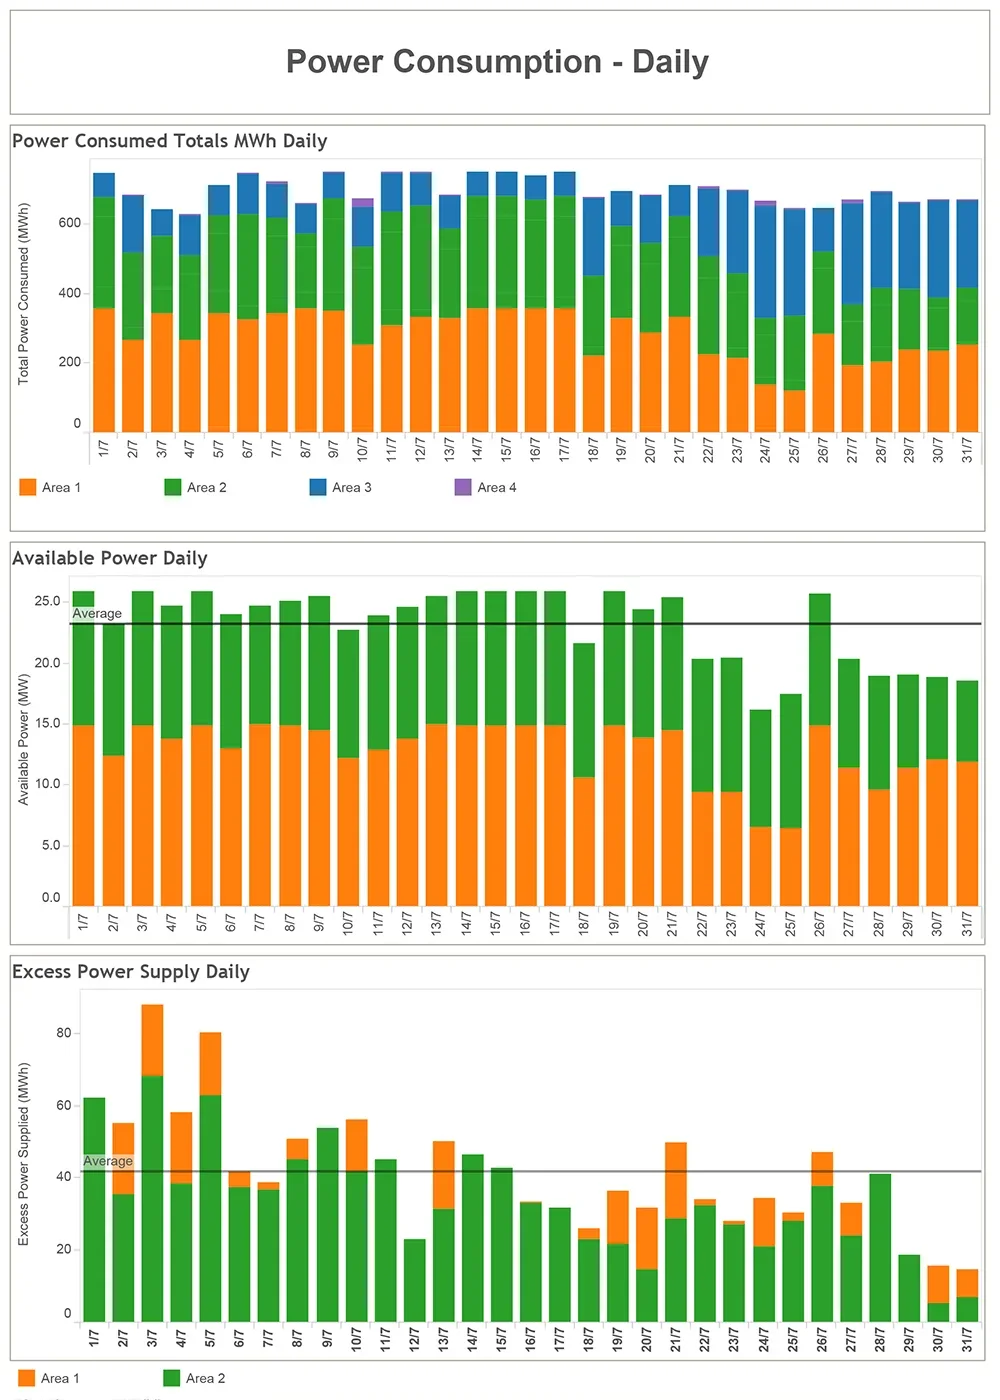
For example, a facility in Africa was using purchased power to report on Scope 2 emissions, however analysis showed that the amount did not align with production. The plant had attempted to uncover the inefficiencies that led to the misalignment, however once a digital twin was implemented with power data incorporated into the dynamic mass balance, the site was able to uncover that electrowinning equipment was less reliable than expected and had been the cause.
In fact, 42 MWh or US$1.5m per year of electricity was uncovered as being purchased in excess of what was being used at the plant. In addition, the digital twin model was able to calculate the Scope 2 emissions using an activity-based method from plant information rather than the standard spend-based method. As a result, the site was over-reporting Scope 2 emissions by 7.5 percent or 8,000 t-CO2e/year.
How can a process digital twin overcome the data challenge?
Process digital twins provide a digital replica of the process flow within an industrial plant, developed using computer software. They are based on a dynamic simulation of the process chemistry and thermodynamics of the plant. The dynamic model has automated integration with plant source data and performs a full plant-wide mass and energy balance that considers conservation laws, phase equilibria, heat and mass transfer and kinetics.
The mass, energy and rate of accumulation with respect to time provide unique insights into exactly what is happening inside the processing plant at any point in time. The integration and wait times for laboratory assays and the solver calculations mean the data from these simulations are delivered within hours. Process digital twins leverage Internet of Things (IoT), big data storage and integration, machine learning and advanced database structures to deliver fast, actionable insights to stakeholders via dashboards and visualisation tools.
A process digital twin integrates with existing systems and is customisable to the plant and its processes. It automatically centralises huge volumes of data from multiple sources across the operation and supply chain and uses machine learning to validate and organise the measured (from instrumentation) and calculated (from the simulation) data.
The twin uses dynamic simulation to perform a plant-wide mass and energy balance to reconcile delivery, consumption, inventory and production activity data. Using source data as inputs, the simulated data contextualises the measured activity data for completeness and accuracy.
This means the verified sustainability indicators are fully traceable, immutable and unalterable, and surpass any rigorous sustainability audit tests for complete assurance.
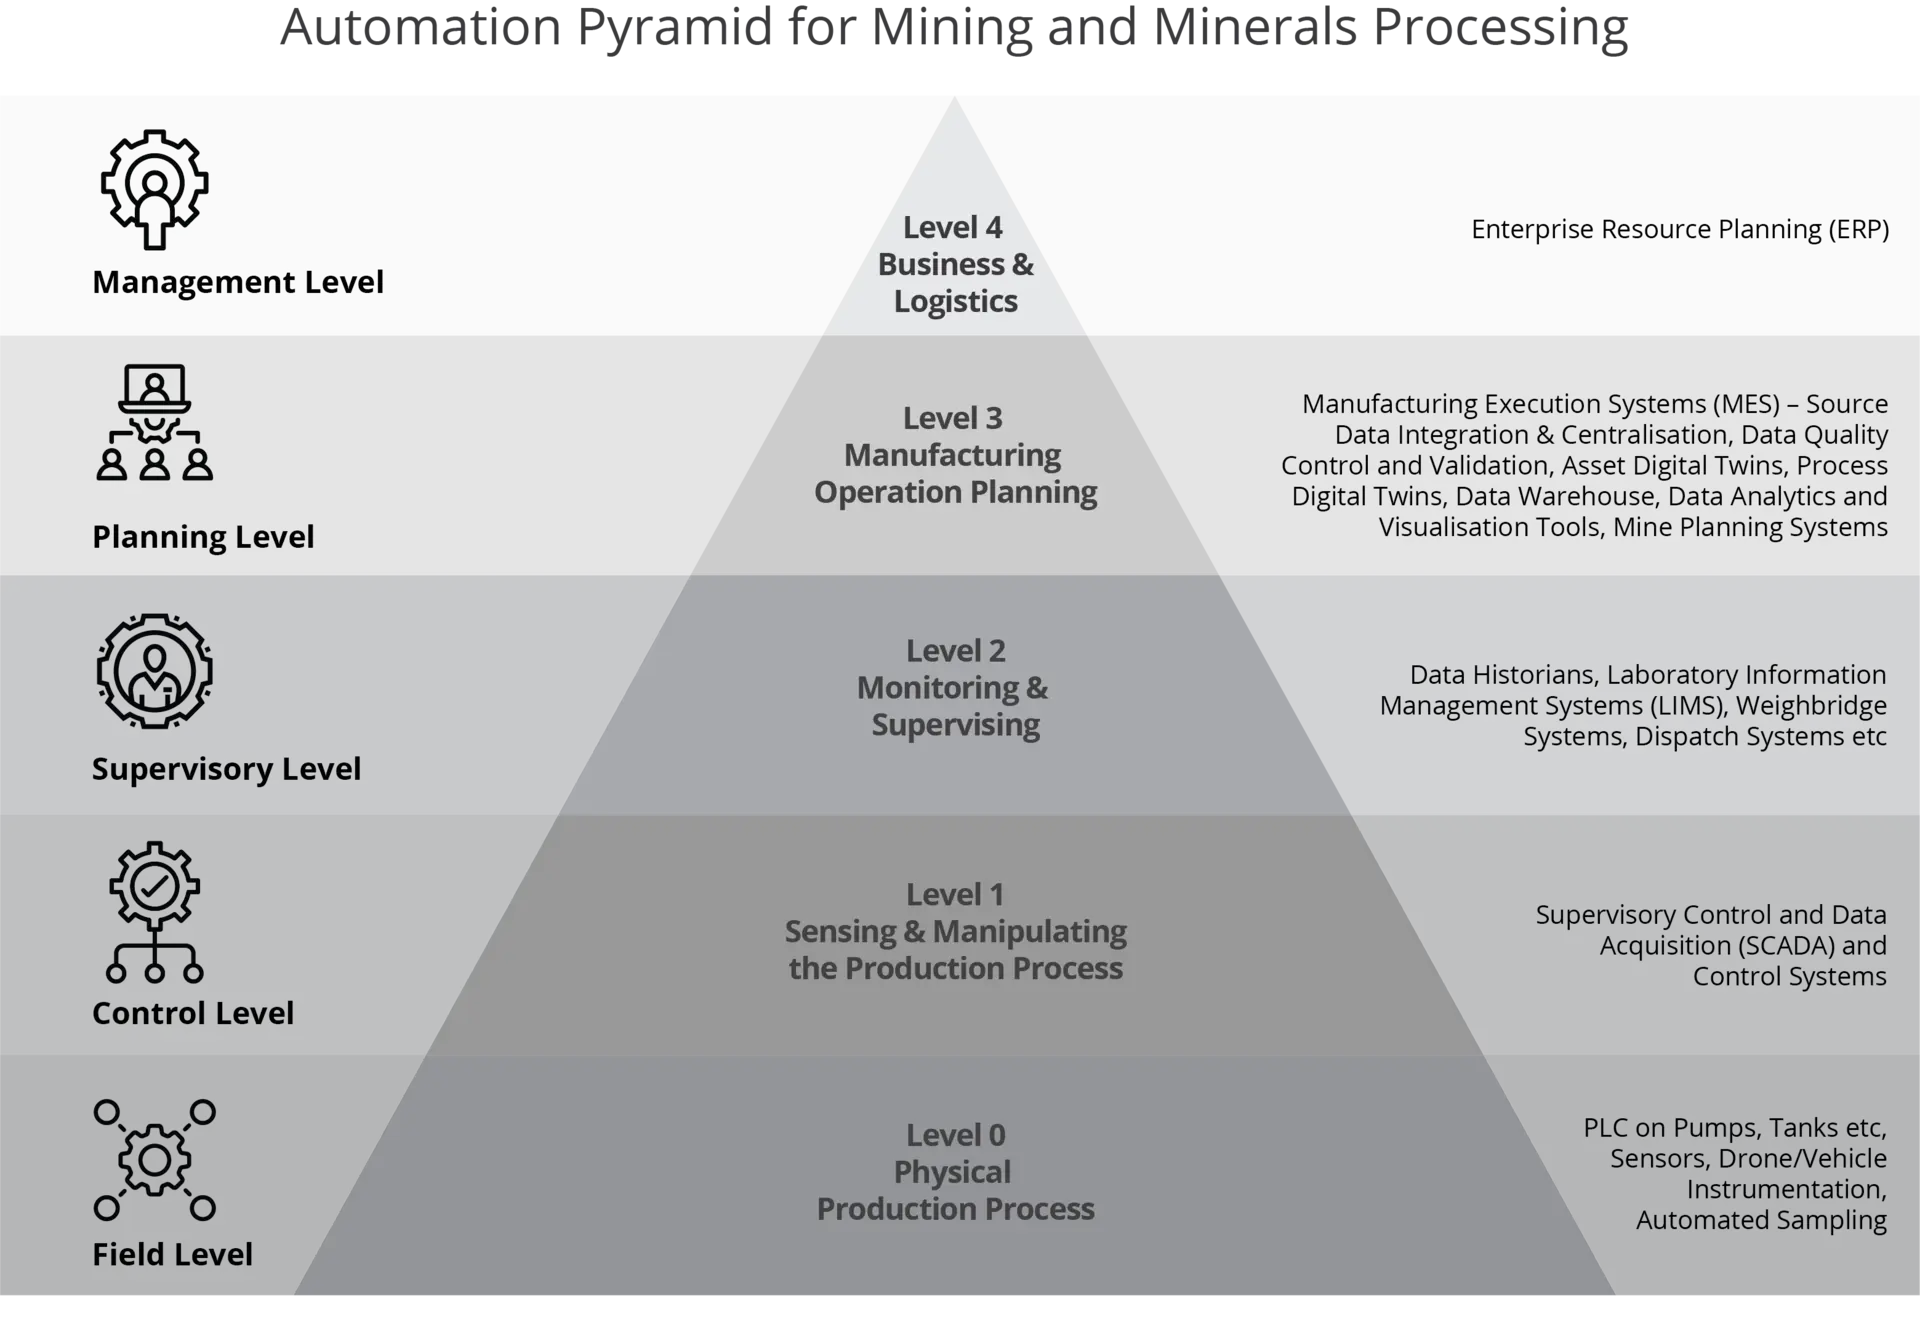
To understand how process digital twins work in the resources sector to deliver best-practice sustainability reporting, it can be helpful to reference the automation pyramid – a model based on the international standards ANSI/ISA 95 developed by the International Society of Automation.
Essentially, this model provides standards as to how different enterprise and control systems should work together to reduce errors, risk and costs. It is a well-established model that is widely adopted in the resources sector.
The image below provides an overview of the levels of automation for the resources sector. The automation pyramid is derived from ISA95 and adapted for the mining and minerals processing industry.
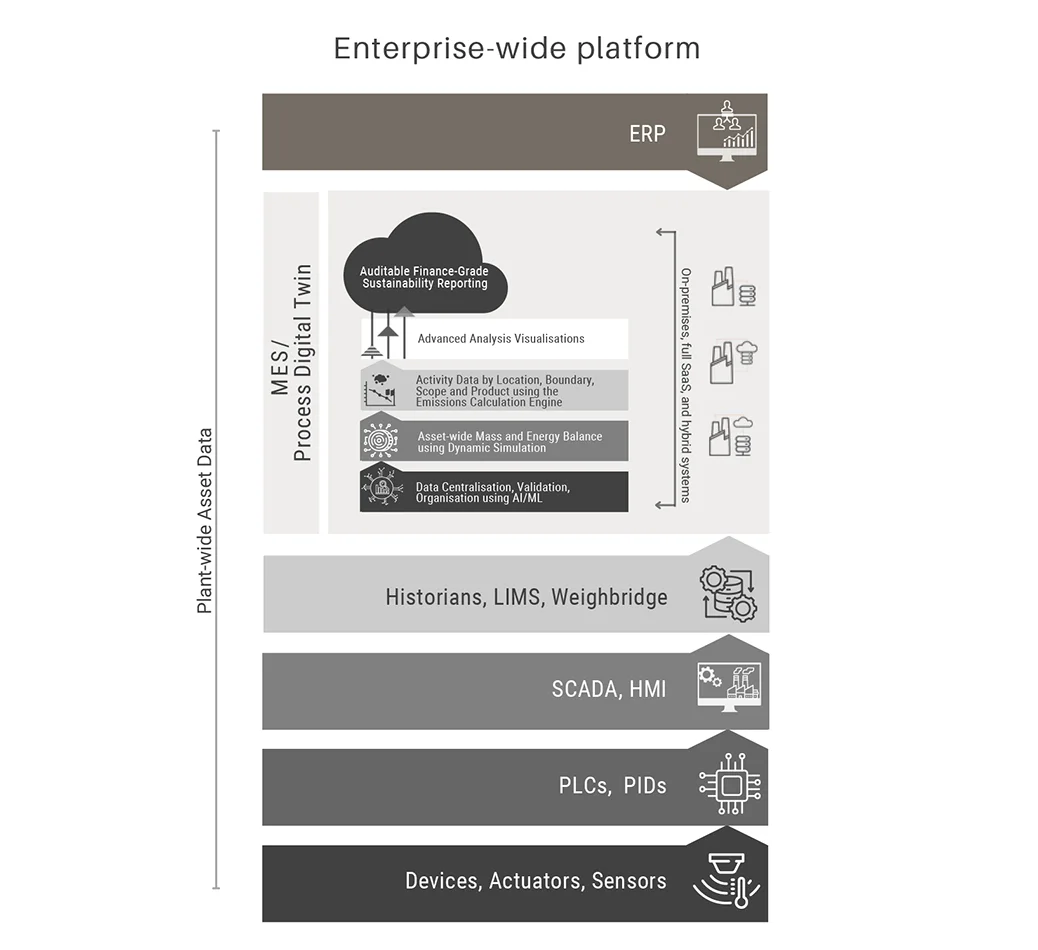
Over the last ten years, innovations in digitisation – part of Industry 4.0 – have led to some incredibly advanced solutions, or digital-twin-enabled Mining/Manufacturing Execution Systems (MES), being developed for the planning level of the automated pyramid.
These fully automated digital-twin-enabled MES solutions are designed to take data from the field, control and supervisory level solutions and transform this raw data into contextualised information. The context is derived from using a detailed dynamic plant model and incorporating appropriate chemistry based on the verified flowsheet. Source-measured plant data is centralised, validated, organised, and subjected to data quality analysis, using intelligent new methods such as machine learning. Dynamic simulation technology is then used to process this data and perform a full plant-wide mass balance every hour. This provides a plant’s stakeholders with a level of granularity of processing information, including constant work-in-progress inventories, directly traceable to plant data sources that was never before possible.
By looking at the calculated ‘outcomes’ from the process digital twin, stakeholders can contextualise and crosscheck their measured plant data and quickly determine where problems are occurring – or where opportunities for improvement lie. All of the data, such as the input data processed by the digital twin and output data calculated by the digital twin, are stored in a data warehouse. From this, user-friendly data visualisations and reports can be generated by authorised stakeholders. The digital-twin-enabled MES can in turn make its data available typically to a Level 4 solution, commonly an ERP solution, for overarching insights.
Why are digital reporting tools the only way to meet evolving regulations?
The need for regular auditable reporting in a machine-readable digital taxonomy, detailed scenario analysis, climate resilience assessments, transition planning and climate-related target setting and progress reports, means that data-driven technology is the only solution to meet evolving sustainability disclosure rules and new reporting standards.
Deploy machine-readable digital taxonomy from day one
Digital reporting taxonomy structures provide a standardised machine-readable format for sustainability reports to enable fast and consistent interpretation and comparison. In a recent article, Dr Andreas Barckow, Chair of the International Accounting Standards Board (IASB) supports digital taxonomy:Delivering machine-readable data relies on consistent and automated electronic data capture, consolidation and output.
In July 2023, the ISSB published a proposed IFRS Sustainability Disclosure Taxonomy for public comment – a digital taxonomy to facilitate digital reporting of sustainability-related financial information prepared using the ISSB standards. This enables digital tagging of information required by the IFRS standards S1 and S2. The ISSB will review feedback to deliver the final digital taxonomy early in 2024. The intention is to improve global accessibility and comparability of sustainability information for investors.
Enable automation, data quality and auditability
Particularly in the resources sector, manual spreadsheets simply cannot capture or process the volumes of data needed to deliver immutable, unalterable and auditable sustainability reports. The biggest challenge is that siloed legacy systems and manual processes mean most organisations lack the data and digital tools to achieve this to the required levels. Often multiple spreadsheets (typically from manual data entry) and exports from other systems across the organisation are consolidated and analysed to report on sustainability indicators.
The data is raw, not validated and not contextualised. This process is laborious, open to error and data can be changed or lost and would not meet the level of assurance required from investors, company directors and other stakeholders.
Technical example C: Using machine learning to ensure data quality
Ensuring high-quality measured data is crucial to efficient plant operation, sustainability reporting and rapid identification of issues. Manually filtering through instrument data is often far too slow and labour-intensive to be practical.
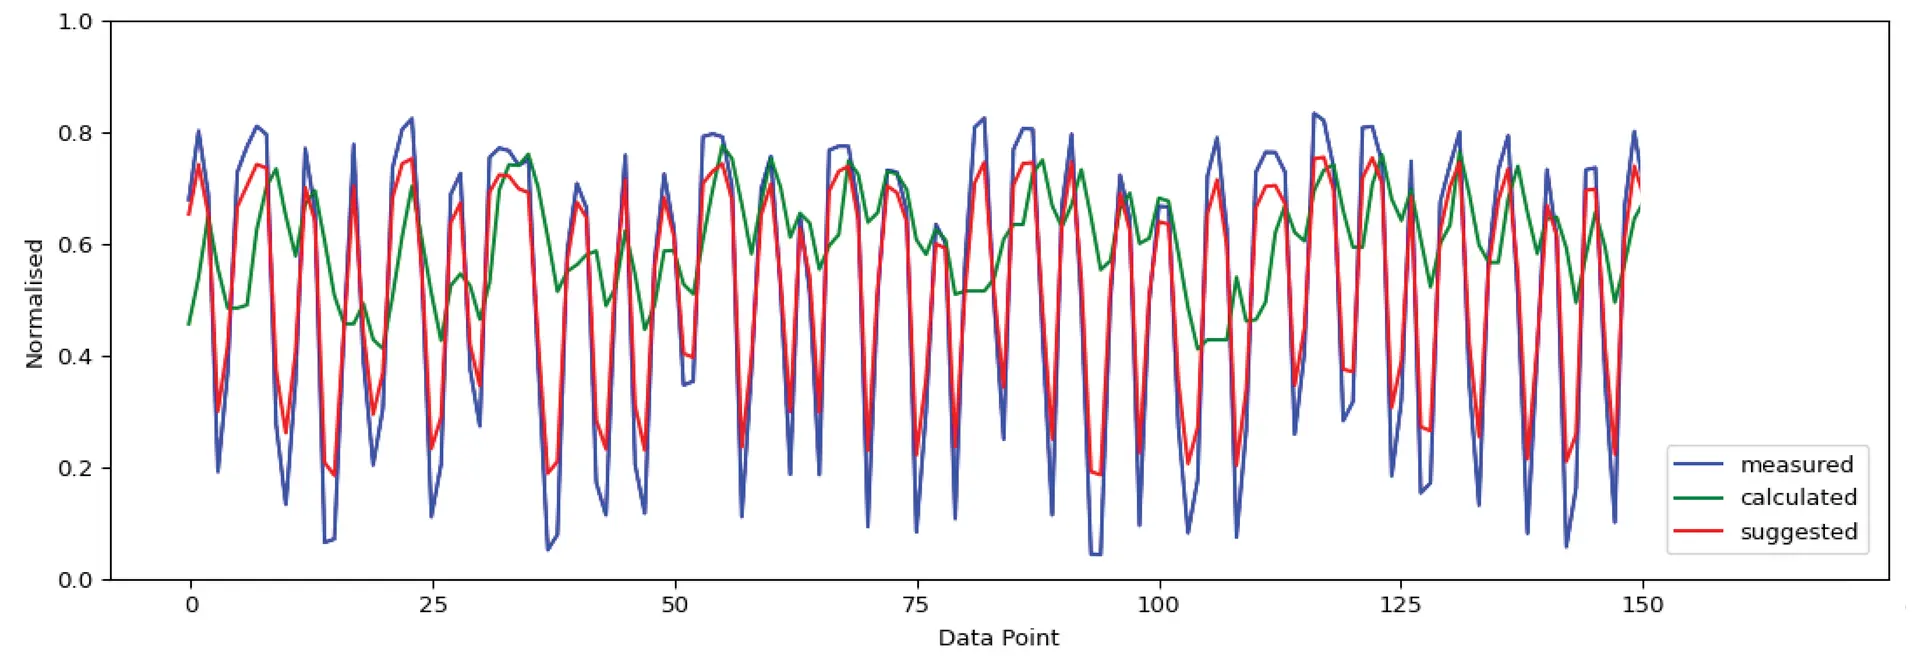
A process digital twin uses machine learning to assess the quality of measured data by taking in various types of source data, like instrument historians, weighbridge systems or laboratory data. Using historical data, the twin can identify unstable measurements and flag them to site personnel. This can indicate faulty instrumentation, poor calibrations, or other potential process issues. By considering all measured data in the surrounding equipment group, the twin can predict suggested values for measurements and flag inaccurate ones.
For example, as shown in the graph below, a level instrument on a feed storage bin was recording inaccurate values (blue). These values were being used directly in a digital twin dynamic mass balance to calculated values (green). However, according to up and downstream instrumentation, the level instrument was not calibrated correctly, as uncovered by the data quality system indicating poor stability. Resolving this issue would allow for more accurate control of the process through more accurate feed blending.
Technical example D: Using dynamic simulation to validate data and close data gaps
Often, measured data does not reflect actual plant operations due to faulty instrumentation, lack of calibrations or poor sampling. The use of a digital twin dynamic model can accurately identify not only when this measured data is faulty, but also what actual consumption/production rates and quality should be.
For example, a site in Africa had instrument-recorded mill feed rates that severely underreported the mass of feed material being fed to the circuit, resulting in inaccurate reporting of production and recovery metrics.
In the extract below, blue is the plant-measured data and red is the digital twin calculated data. The digital twin model was able to calculate the actual consumption through the plant based on all the available data, as well as validate surrounding sources of data.
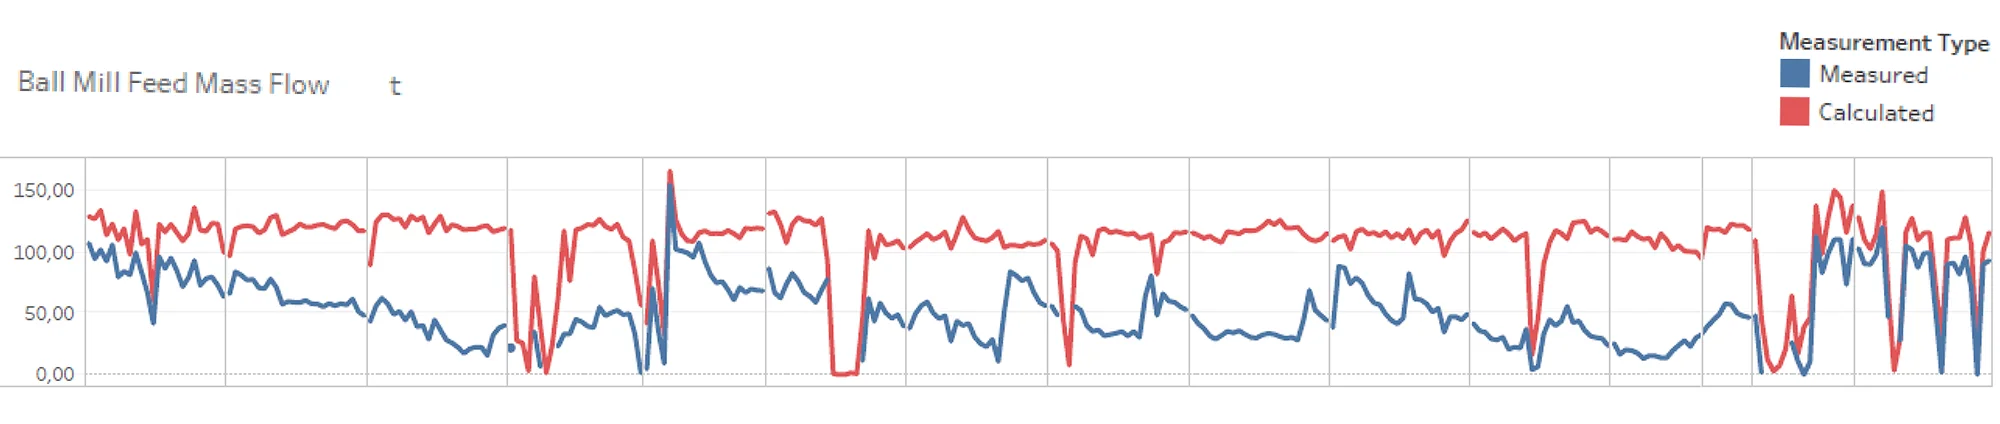
Through leveraging the digital twin calculated data, the site team was able to identify that this instrument was under-reading by up to 65 percent.
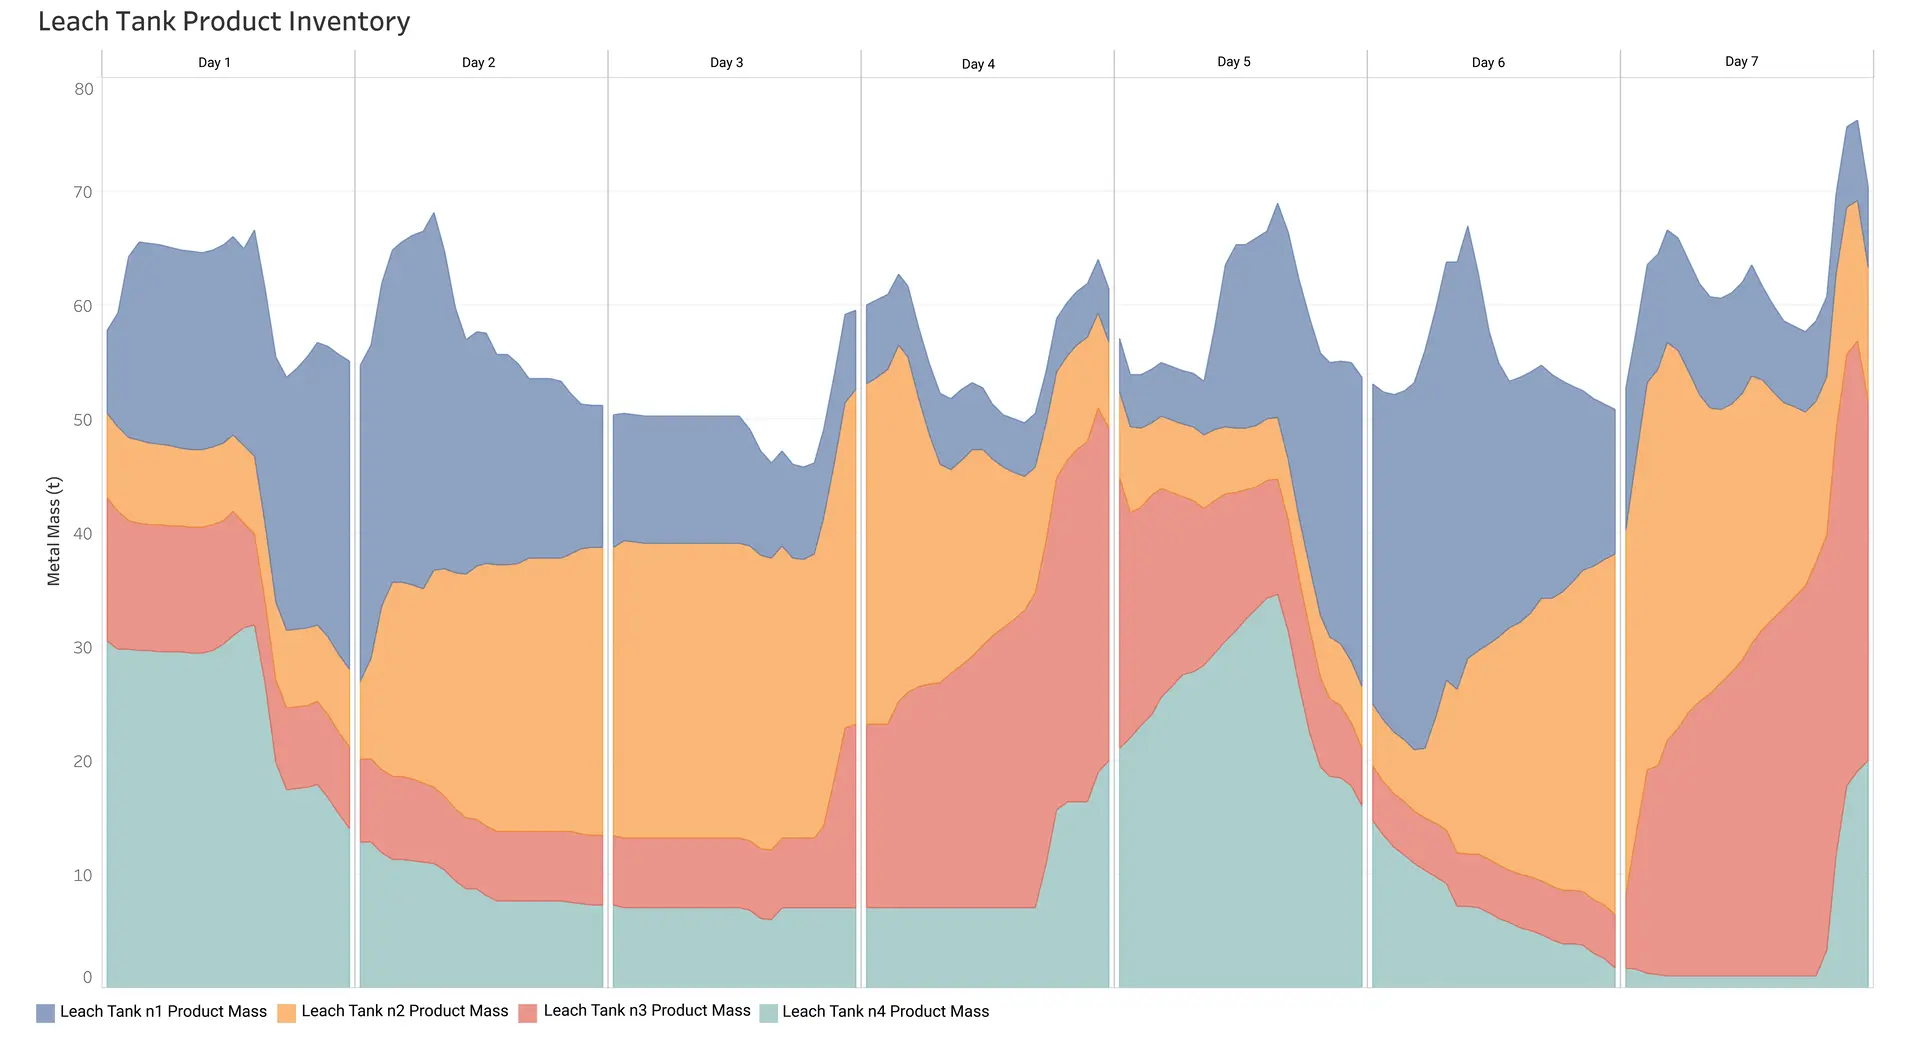
The digital twin is also able to calculate streams and inventories that could not be measured by the site at an hourly level. For example, the site had leach tanks that did not have instrumentation monitoring the contents of each leach tank (see graph below).
Due to the complex nature of the site’s leach tank operations, it was difficult for the site to predict or calculate the contents themselves. Instead, the digital twin was able to calculate not only the total content but also the product contained within each tank.
These insights allow the site to better control its leach and downstream processes through a better understanding of continuous work-in-progress inventory calculations. In the graphic below, each colour represents a different leach tank, and the mass of total metal inventory is monitored and used to monitor and control the process.
Technical example E: Using dynamic simulation to validate consumption use of reagents
Using a process digital twin, the dynamic mass balance can be used to reconcile plant-measured values including plant instruments, laboratory results, deliveries of feedstocks and reagents, and final product shipments.
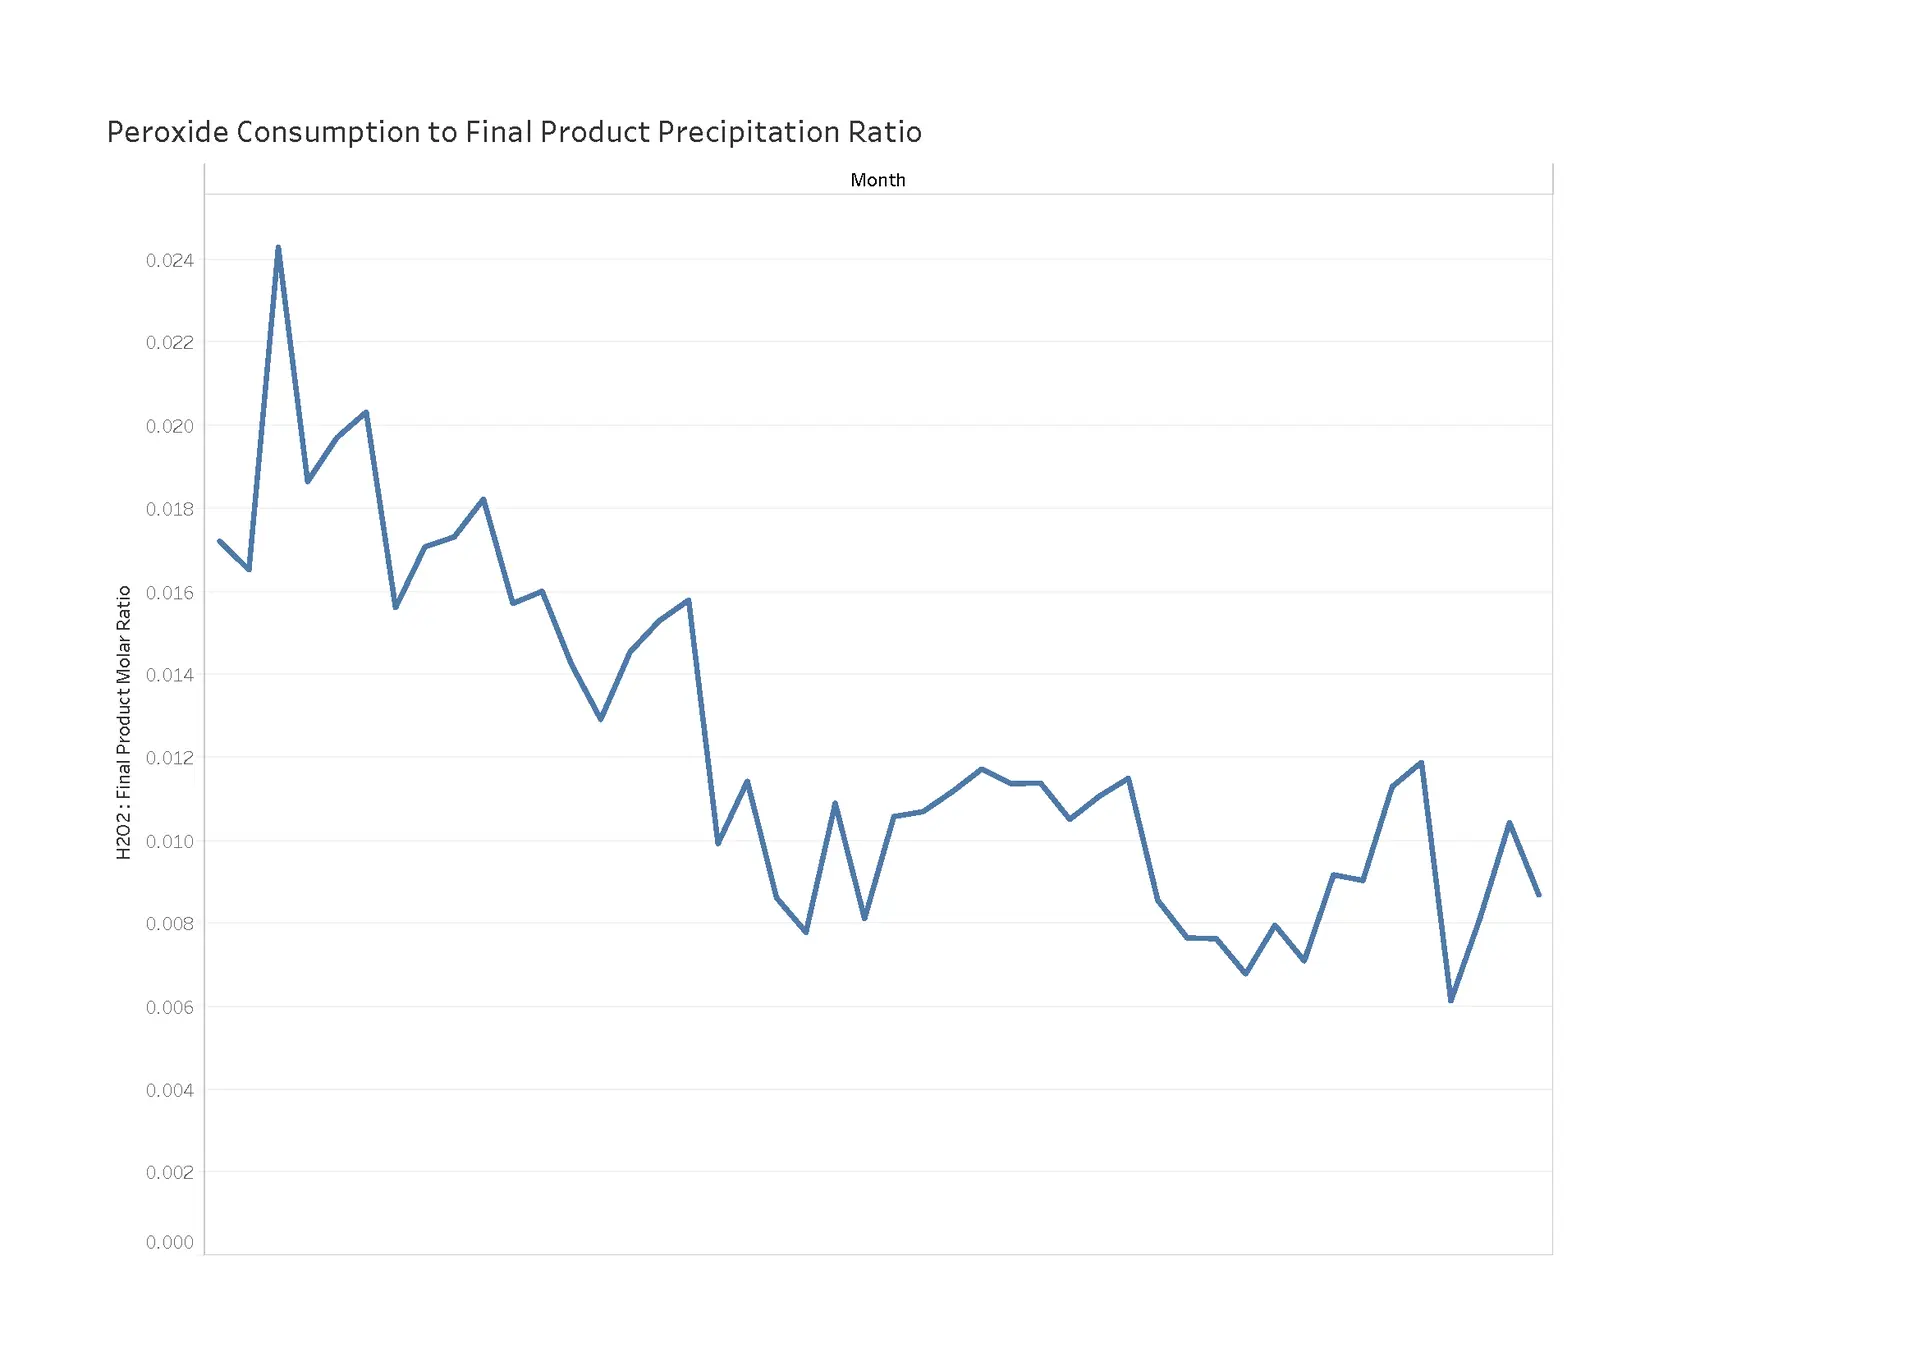
For example, after implementing a digital twin, a site in Africa noticed that their hydrogen peroxide reagent deliveries did not align with consumption data. This consumption data was calculated by the digital twin through process chemistry and other available plant data and the model-calculated values could not align with both figures, which triggered a review of the source data. It appeared that the delivered mass was more than double the reported consumption of peroxide.
Further investigations found that the installation of the peroxide consumption instrument was done incorrectly, resulting in the flowmeter under-reading by over 100 percent. The chart below shows the actual peroxide consumption to final product molar ratio over time, which has declined to less than half of the original value over the period.
As this flowmeter was used to control the peroxide addition into the process, it was discovered that the peroxide consumption was far in excess of what was actually required. In resolving this issue, the site saved US$475,000 per year in hydrogen peroxide deliveries alone.
Not only was the site able to reduce operating costs significantly, but also reduce Scope 3 emissions associated with hydrogen peroxide production and transport, roughly equivalent to 1,000 t-CO2e/year or around US$100,000 per year in carbon credits within the EU.
Track scopes 1, 2 and 3 emissions and industry-specific disclosures
- Summary of Scope 1, 2 and 3 GHG emissions requirements in Australia:
- Scope 1 and Scope 2 gross, as set out by the NGER Scheme legislation
- Scope 3 that are material (from their second reporting year onwards). Scope 3 disclosures include upstream and downstream and are to be reported with a recognised emissions accounting framework (such as the GHG Protocol) and be informed using domestic emission factors (such as the National Greenhouse Accounts Factors).
- Industry-specific standards:
- reporting entities would be required to have regard to disclosing industry-based metrics (where there are such metrics following a proposed consultation with members of that sector that are most relevant to their business model).
- for resources companies the SASB industry-specific standards such as “Extractives & Minerals Processing” with industries coal operations, construction materials, iron & steel producers and metals and mining, are a good guide in the interim.
Technical example F: Measuring and reducing Scope 1, 2 & 3 and industry-specific disclosures/indicators
Scope 1
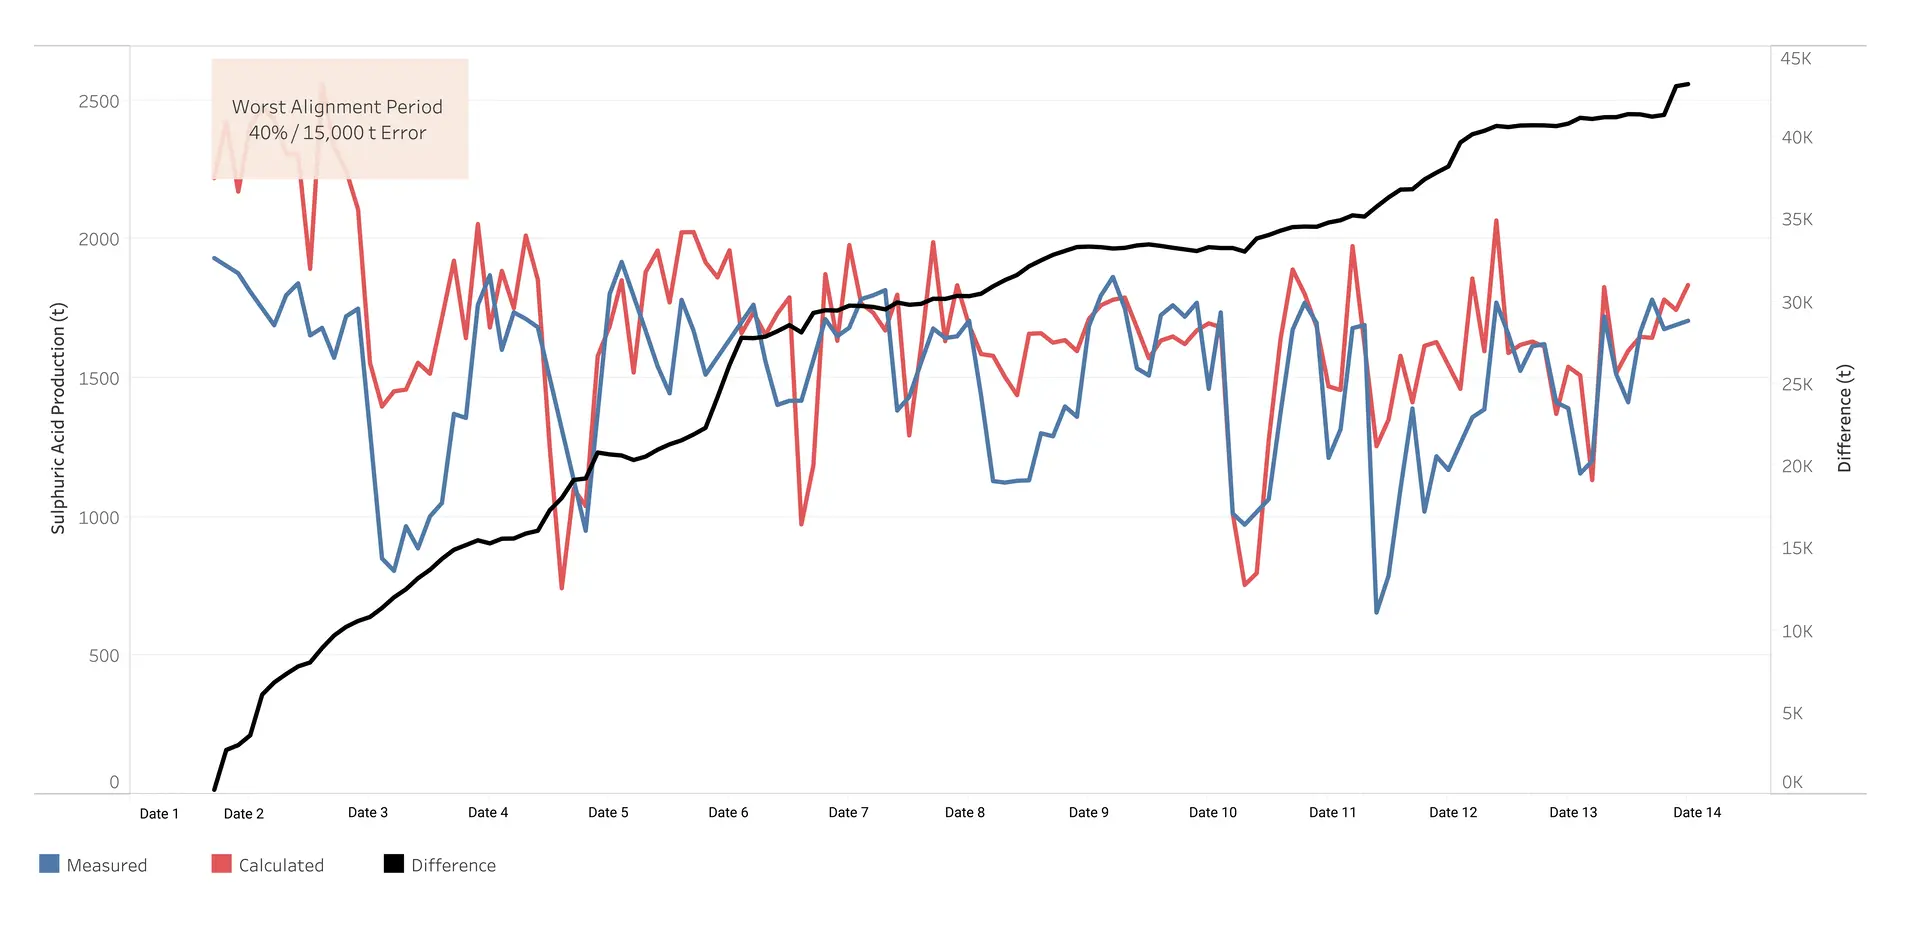
A process digital twin can be used to accurately calculate and/or validate Scope 1 emissions using process data and plant chemistry. For example, a facility in Kazakhstan had been recording SO2 emissions with gas analysers, which were not working properly. The gas was fed to the acid plant, and it was assumed that there were few losses due to a lack of instrumentation that suggested otherwise.
Using the digital twin mass balance, the SO2 analysers were identified to not be working correctly, and as shown in the graph below the discrepancy between the measured (blue) and calculated (red) SO2 emissions was quantified (black).
The plant had measured 16.5 percent or 350 tonnes of acid per day lower than the model-calculated results. Over the time period analysed, this equated to 43,000 tonnes or 26 percent of the plant-measured amount.
As the sulphur feed to the plant was determined to be accurately measured, the results indicated high sulphur dioxide losses from the stacks, equivalent to US$21m per year, not accounting for the risk of significant fines depending on regulatory requirements.
Scope 2
While purchased electrical power is commonly used to calculate Scope 2 emissions, using an activity-based method is more reliable for accurate reporting. For example, as detailed above in Technical example B: Using activity data to accurately measure Scope 2 emissions a facility in Africa used an activity-based method to uncover that it was over-reporting Scope 2 emissions by 7.5 percent or 8,000 t-CO2e/year.
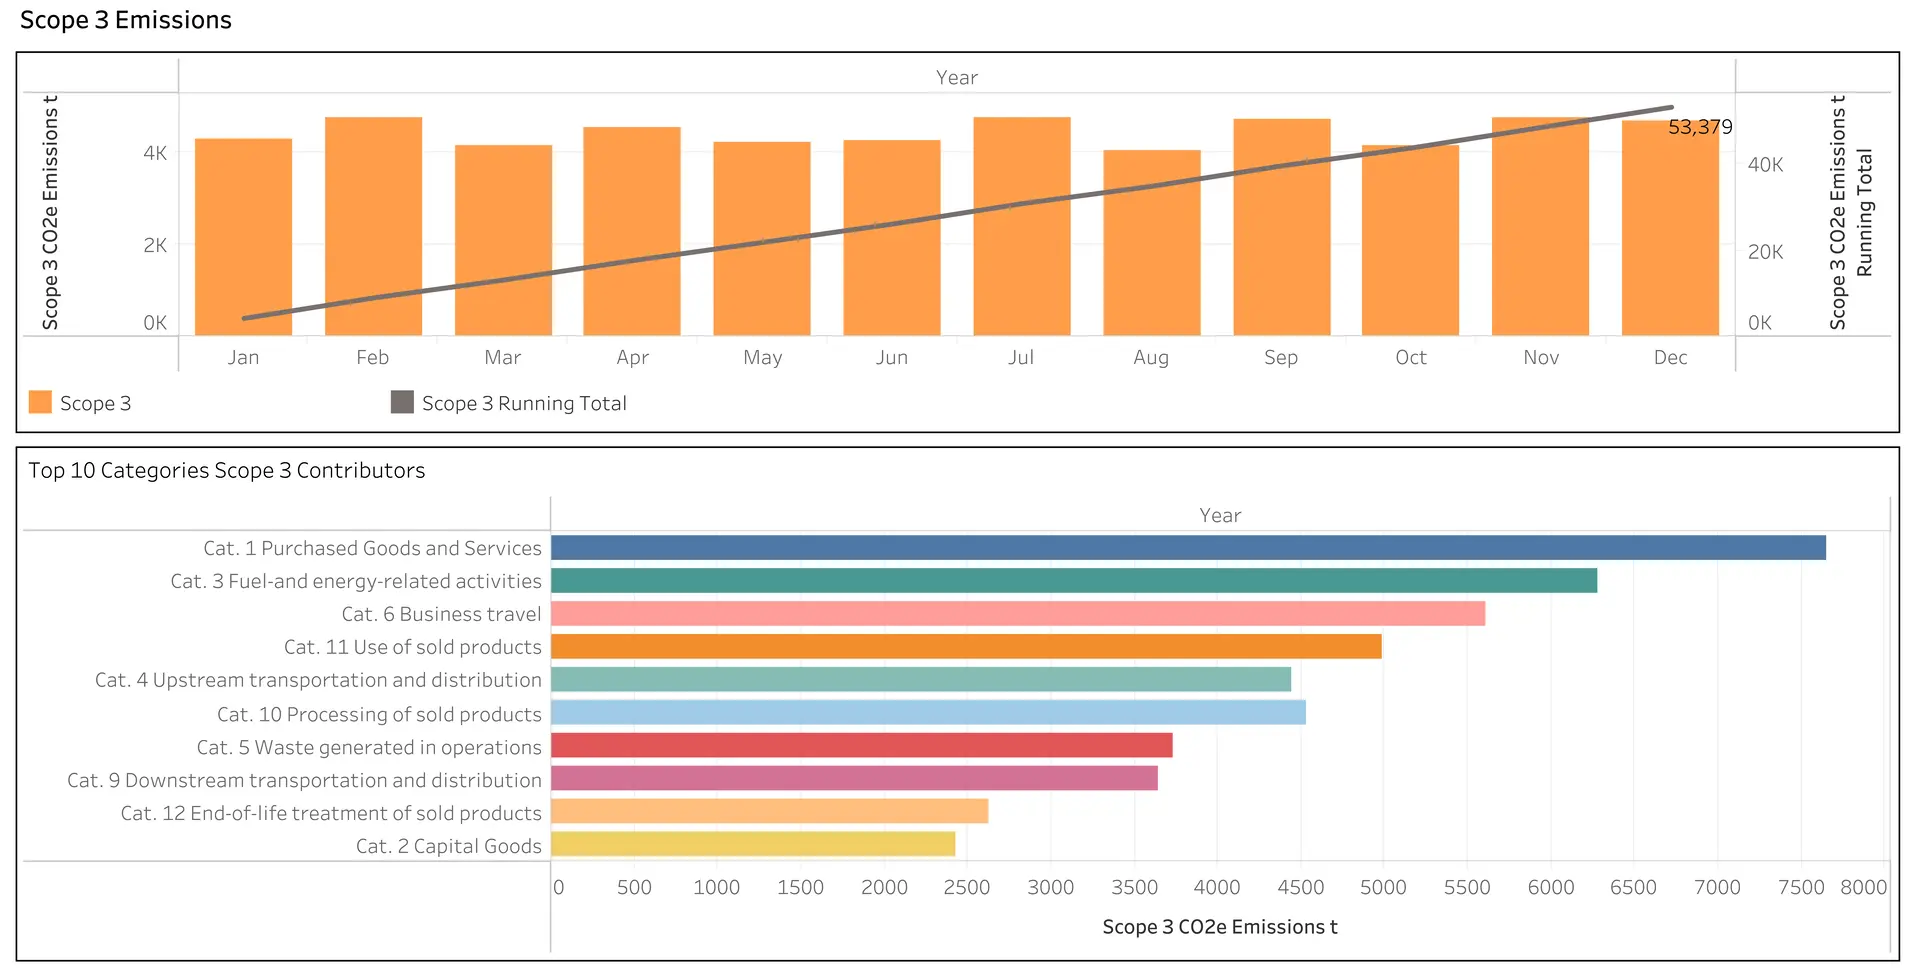
Scope 3
Whilst Scope 3 emissions can make up 70-80 percent of a site’s total emissions, they are often poorly understood and misreported. A large portion of Scope 3 emissions for metallurgical facilities come from the production and delivery of reagents used within the plant, however Scope 3 emissions also come from sources that are more difficult to monitor such as business travel, delivery, use and processing of sold products and impact of waste and byproducts.
These Scope 3 emissions often are calculated using a combination of unclear assumptions, default input values and formulas that cannot be easily audited, validated or traced back to the original source.
A process digital twin can measure and trace all of these calculated values back to the source, whether it be a specific user-entered value, calculated from instrument/lab data, use a range of default inputs or a combination of these.
Having access to this data enables organisations to meet the necessary reporting requirements, understand their operation and proactively work to reduce Scope 3 emissions.
Data-driven forward-looking statements using scenario analysis
Traditionally, financial statements looked at historical performance, whereas the ISSB sustainability reporting disclosure requirements are strongly future-focused, and companies will be required to use scenario analysis when assessing their climate resilience.
As summarised above in TABLE 3 – Summary of reporting requirements for Australian resources companies the new frameworks will mandate scenario analysis for multiple possible future states that reflect different climate future(s) and targets.
One of the biggest concerns for organisations lies in the confidence they have in the quality of their data. Digital tools – using artificial intelligence (AI) such as machine learning (ML) and artificial neural networks – automate data collection, validate and contextualise data, and simulate and calculate more data to close data gaps. Companies use the predictive capabilities of these models to test various future scenarios with confidence and to report on their assessment of climate resilience.
Technical example G: Using a process digital twin to calculate the material financial impact of net zero targets
By integrating multiple data sources and reconciling plant data, a digital twin can extract the data to demonstrate the financial costs of meeting reduction targets (including offsets) without the burden of manual reporting.
For example, the introduction of activity-based data in a metallurgical plant uncovered that it was purchasing 42 MWh or US$1.5m per year of excess electricity as a result of faulty equipment that had gone unnoticed. Refer to graphs and details in Technical examples B and F above.
As a result, the site was able to save on their power consumption, but also more accurately report on their Scope 2 emissions, which was 8,000 t-CO2e/year lower than what they had previously calculated using a less accurate method. This is approximately US$800,000 per year worth of carbon permits (based on current EU prices).
Another site was able to reduce their Scope 3 emissions related to fuel consumption by 1,000 t-CO2e/year or US$100,000 of carbon permits (at current EU prices) after the implementation of a digital twin. The site was able to recognise the contribution of this fuel to their overall Scope 1 emissions – which made up the bulk of the site’s carbon intensity – and investigate alternative fuels as a result of the access to accurate data.
Transition planning and climate-related targets
To comply with the new reporting frameworks Australian resources companies would need to meet the following transition planning and climate-related targets:
- transition plans need to be disclosed, and information about target setting, offsets and mitigation strategies
- disclose information about climate-related targets and progress towards these targets – are they Science Based Target Initiative (SBTI) that has been verified/validated by a third party – and how their chosen target compares to the global temperature goal set out in the Climate Change Act 2022 and Australia’s nationally determined contribution.
Technical example H: Transition planning, target setting and emissions reduction
An industrial facility needed to reduce its Scope 1 emissions sourced from neutralisation via limestone (as detailed in Technical example A). With the help of digital tools, they discovered that over 30 percent of their Scope 1 emissions were sourced directly from the use of this reagent, not accounting for Scope 1, 2 or 3 requirements associated with the preparation, transport, and production of this reagent.
Using the digital twin and steady-state simulation, a what-if analysis is performed for the quantitative metrics around transition planning, target setting and emission reduction. This allowed for the calculations around transition planning for considering alternate flowsheets, changes to typical operating conditions, physical effects of climate on the facility, and capex and opex budgeting for planning. All results calculated can then be directly compared to actual current plant values, including Scope 1, 2 and 3 emissions. The site investigated further into alternative scenarios that could allow for alternative neutralents to be utilised, such as caustic.
The overall change to Scope 1, 2 and 3 emissions could be calculated from switching to caustic from limestone, accounting for changes to the process, reagent preparation and associated Scope 1, 2 & 3 emissions. The site was then able to make an informed decision on the overall change to total emissions intensity.
Nature-related disclosures
While not yet part of the reporting framework, it is important for resources organisations to start preparing for what will be needed to measure nature-related disclosures in line with the TNFD and future topic-specific ISSB and EU standards. Here is a summary of expected requirements:
- the EU Corporate Sustainability Reporting Directive (CSRD) and the ESRS are leading the way for nature-related disclosures. Subject to materiality, companies are required to disclose biodiversity and ecosystem-related topics such as ESRS E4 Biodiversity and Ecosystems, E2 Pollution, E3 Water and Marine Resources and E5 Resource Use and Circular Economy
- the Australian treasury consultation paper highlights the need to implement a regulatory framework for reporting in other environmental impact areas such as nature and biodiversity
- the ISSB looks to introduce more topic-specific standards that complement the Climate Standards with the recommendation of the Task Force on Nature-related Financial Disclosures (TNFD Recommendations).
Technical example I: Using a process digital twin for TNFD indicators
Global mandates are requiring facilities to monitor a range of environmental factors beyond just greenhouse gas emissions. For example, tracking the release of aqueous polluting solutes is necessary to understand the overall environmental impact of a site. While sites may measure total effluent discharge or concentration of pollutants, the level of reporting is not present at many sites in order to monitor and improve on the release of these pollutants.
Using a digital twin and centralised database, it is possible to calculate the release of these pollutants using a range of hourly plant data and clearly report traceable data. Digital tools can also incorporate habitat information to allow for reporting of solute emissions and report on solute release per habitat type, giving a broader picture of environmental factors. This allows personnel to quickly identify and resolve issues within the plant that may have caused unexpected spikes in pollutant discharge.
Specific aqueous species such as sulphate concentrations can be modelled within the digital twin and reported at different locations in the site to indicate effluent discharge, even if these species are not routinely measured.
Product Carbon Footprinting (PCF)
PCF is the sum of GHG emissions generated by a product over the various stages of its lifecycle: cradle-to-gate and cradle-to-grave. PCF is also expected to become something resources companies will be required to measure and report on in detail as summarised in TABLE 3 – Summary of reporting requirements for Australian resources companies.
Technical example J: Measure emissions down to a product level across the supply chain
Reporting emissions to a product level is becoming increasingly more important, although it remains challenging for metallurgical plants that have numerous sources of Scope 1, 2 and 3 emissions across multiple products.
Embodied carbon, as calculated by facilities, is a method commonly employed as it can be determined relatively simply with instrument and laboratory instrumentation. However, this method is becoming inappropriate as emissions reporting legislation changes to require Scope 1, 2 and 3 emissions to be associated with these products outside of the carbon simply contained within final products.
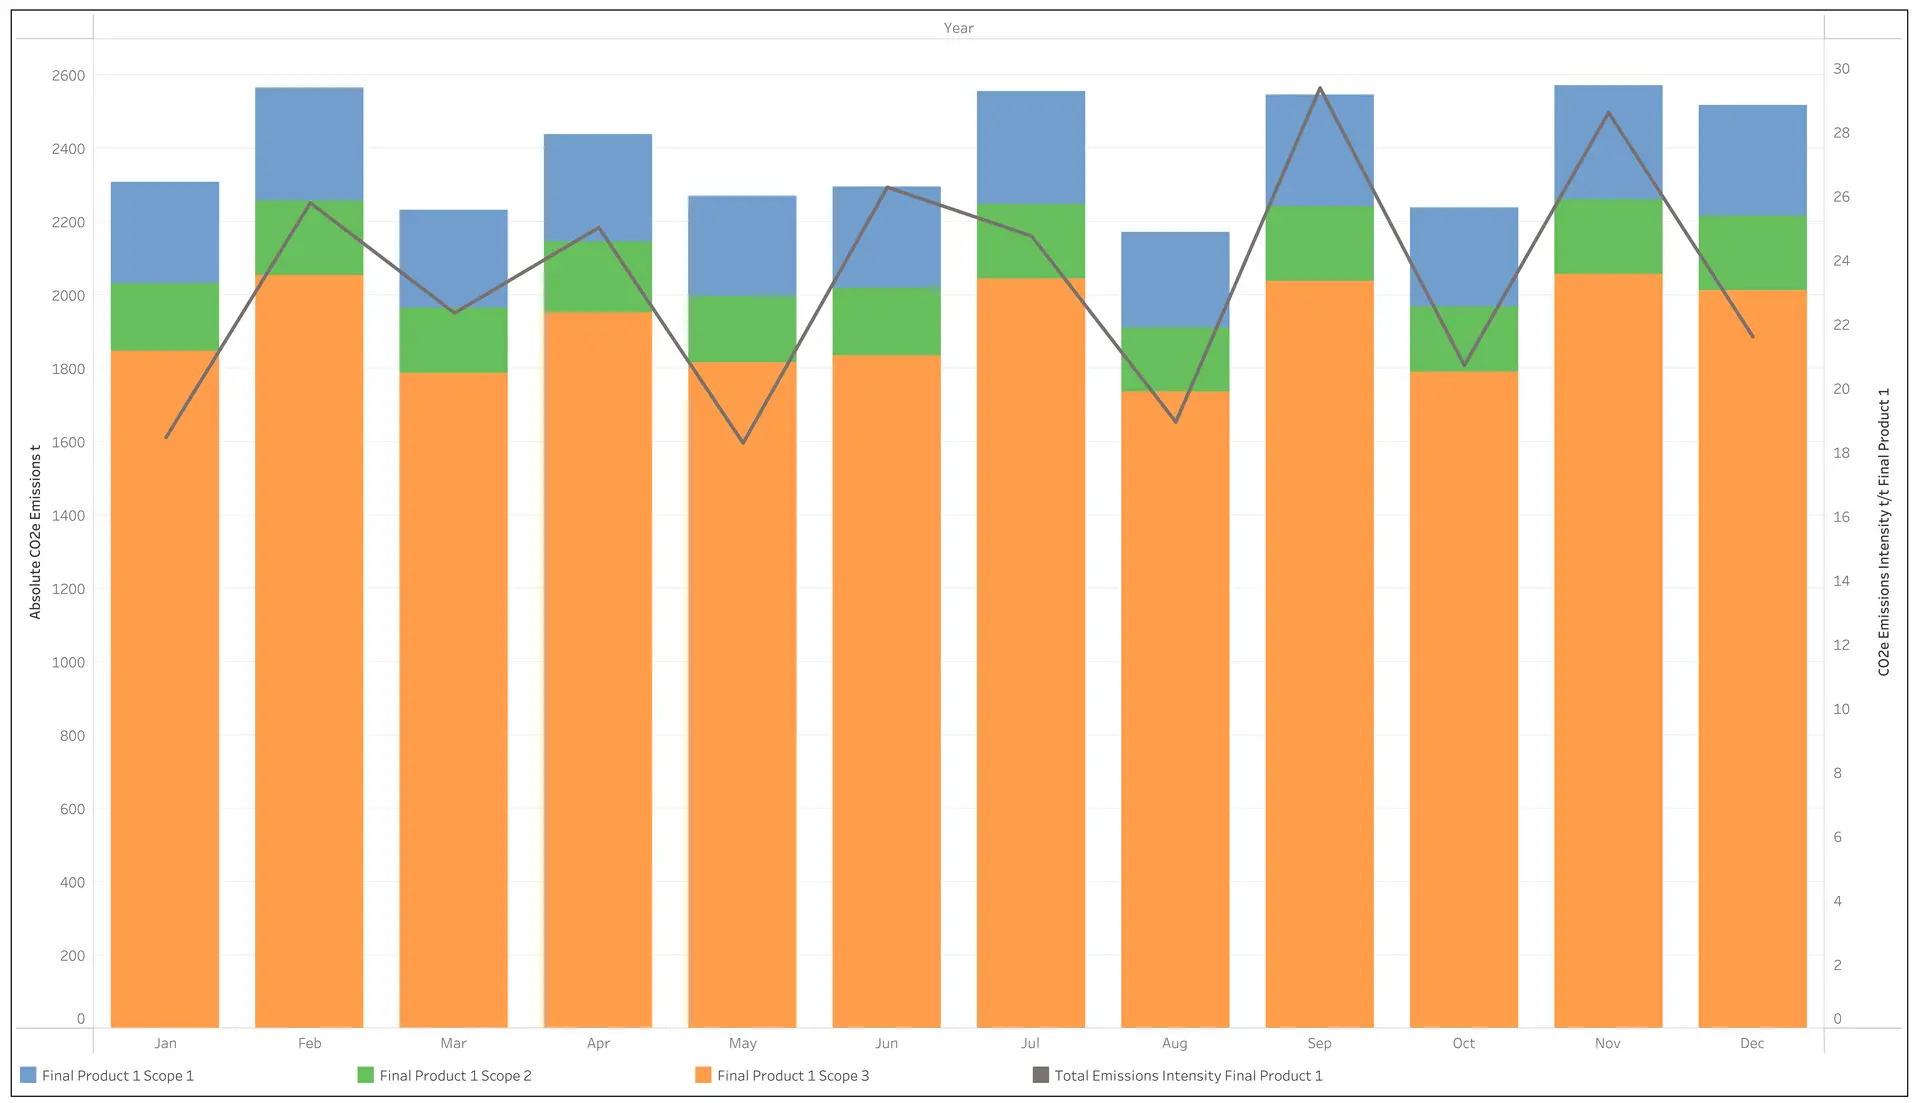
For example, a site in Africa implemented a digital twin solution to calculate and report product-based carbon emissions. Through monitoring site activity data via a digital twin dynamic model, carbon emissions can be accurately calculated throughout the plant (even where direct measurements were not available) and allocated to the five final products that the facility exports.
This includes emissions from site activities associated with multiple products or electricity/reagent consumption at specific points in the plant flowsheet. Due to the transparency and auditability of the digital twin, the flow of data through the system can be tracked to understand how all final emissions values were obtained. Reporting is automated and simplified as well.
As seen below, Scope 3 was a major source of emissions intensity for one of the products at the site. The site wanted to reduce the embodied Scope 3 emissions to improve overall emissions and make this final product more viable for sustainability-conscious buyers. As a result, an alternative fuel was suggested in the production process and the site was able to reduce Scope 1 emissions intensity from this source by 13.5 percent or approximately 1,000 t-CO2e/year.
Conclusions
Rapidly evolving sustainability reporting regulations, combined with accelerating market demand for sustainable products and services, have created significant immediate and long-term implications for the energy-intensive Australian minerals and resources sector.
By outlining the latest regulations impacting the resources sector and detailing what companies need to measure and report on to comply, this paper is designed to help the preparation and decision-making of boards, company directors, executives, governance and risk management professionals, metallurgists, operations managers and senior industry professionals.
It explains how digital tools can be used to overcome this data challenge, concluding with the assertion that digital reporting tools are the only way to deliver the accurate and auditable disclosures necessary to meet new and emerging regulations.
Accurate measurement is the first step towards meeting compliance obligations, and reducing emissions. Tracking and reporting on progress requires two essential ingredients, both of which are enabled by data-driven digital tools: finance-grade sustainability data and an auditable emissions accounting process.
Sustainability and digital transformation are two global business megatrends in recent years. Not only are they complementary, but digitisation is increasingly proven to be a path towards better business and environmental outcomes. Without digital tools, opportunities will be missed.
To discuss how we can help your organisation take control of your sustainability reporting and goals, please contact our experienced team of engineers, metallurgists and technology professionals on +61 2 7229 5646 or info@metallurgicalsystems.com
Related resources


- Australian Government Clean Energy Regulator, 2023. The Safeguard Mechanism [Accessed: 4 September 2023]
- Australian Government Clean Energy Regulator, 2023. The Safeguard Mechanism for financial years commencing on or after 1 July 2023 [Accessed: 4 September 2023]
- Australian Government Clean Energy Regulator, 2023. Record keeping and compliance [Accessed: 4 September 2023]
- Australian Government Department of Climate Change, Energy, the Environment and Water, 2023. Safeguard Mechanism Reforms – Position Paper
- Australian Government Treasury, 2023. Climate-related financial disclosure – Consultation paper
- Australian Securities and Investments Commission, 2023. Report 763: ASIC’s recent greenwashing interventions
- Directive (EU) 2022/2464 of the European Parliament and of the Council of 14 December 2022 amending Regulation (EU) No 537/2014, Directive 2004/109/EC, Directive 2006/43/EC and Directive 2013/34/EU, as regards corporate sustainability reporting [Accessed: 4 September 2023]
- European Commision, 2023. Corporate sustainability reporting [Accessed: 4 September 2023]
- European Commision, 2023. European sustainability reporting standards – first set [Accessed: 4 September 2023].
- Evans, N, 2023. Mining giant Rio Tinto books half-year net profit of $US5.1bn but aluminium assets slashed in value, The Australian, 26 July 2023
- Foster, E, 2023. Consider climate-related risks in financial statements, warns IASB, Australian Institute of Company Directors [Accessed: 4 September 2023].
- Greber, J, 2023. Bowen’s ‘green tariff’ to shield steel, cement against carbon leakage, Australian Financial Review, 15 August 2023
- IFRS Foundation, 2018. Standards Project Summary and Feedback Statement: Definition of Material Amendments to IAS 1 and IAS 8. October 2018
- IFRS Foundation, 2023. IFRS S1 General Requirements for Disclosure of Sustainability-related Financial Information [Accessed: 4 September 2023]
- IFRS Foundation, 2023. IFRS S2 Climate-related Disclosures [Accessed: 4 September 2023]
- IFRS Foundation, 2022. IFRS S2 Climate-related Disclosures. Appendix B Industry-based disclosure requirements. Volume B10—Metals & Mining. International Sustainability Standards Board. Exposure Draft ED/2022/S2
- IFRS Foundation, 2023. ISSB consults on proposed digital taxonomy to improve global accessibility and comparability of sustainability information [Accessed: 4 September 2023]
- Philipova, E, 2023. How many companies outside the EU are required to report under its sustainability rules?, Refinitiv [Accessed: 4 September 2023]
About the authors
This article has been collaboratively authored by the team at Metallurgical Systems, and fact-checked and authorised by Managing Director and industry specialist John Vagenas.